![]()
Check our video tutorial for a use case specific to cancer. You can follow the example below afterwards.
Here we present a practical example of SNPnexus usage, demonstrating the selection of query options and annotation categories in the input interface, followed by the assessment of the potential functional roles of query variants from the results available in the output interface. and finally a practical example of how to use the variant filtering system.
The input query used for this example can be downloaded here and the results for this query can be explored here.
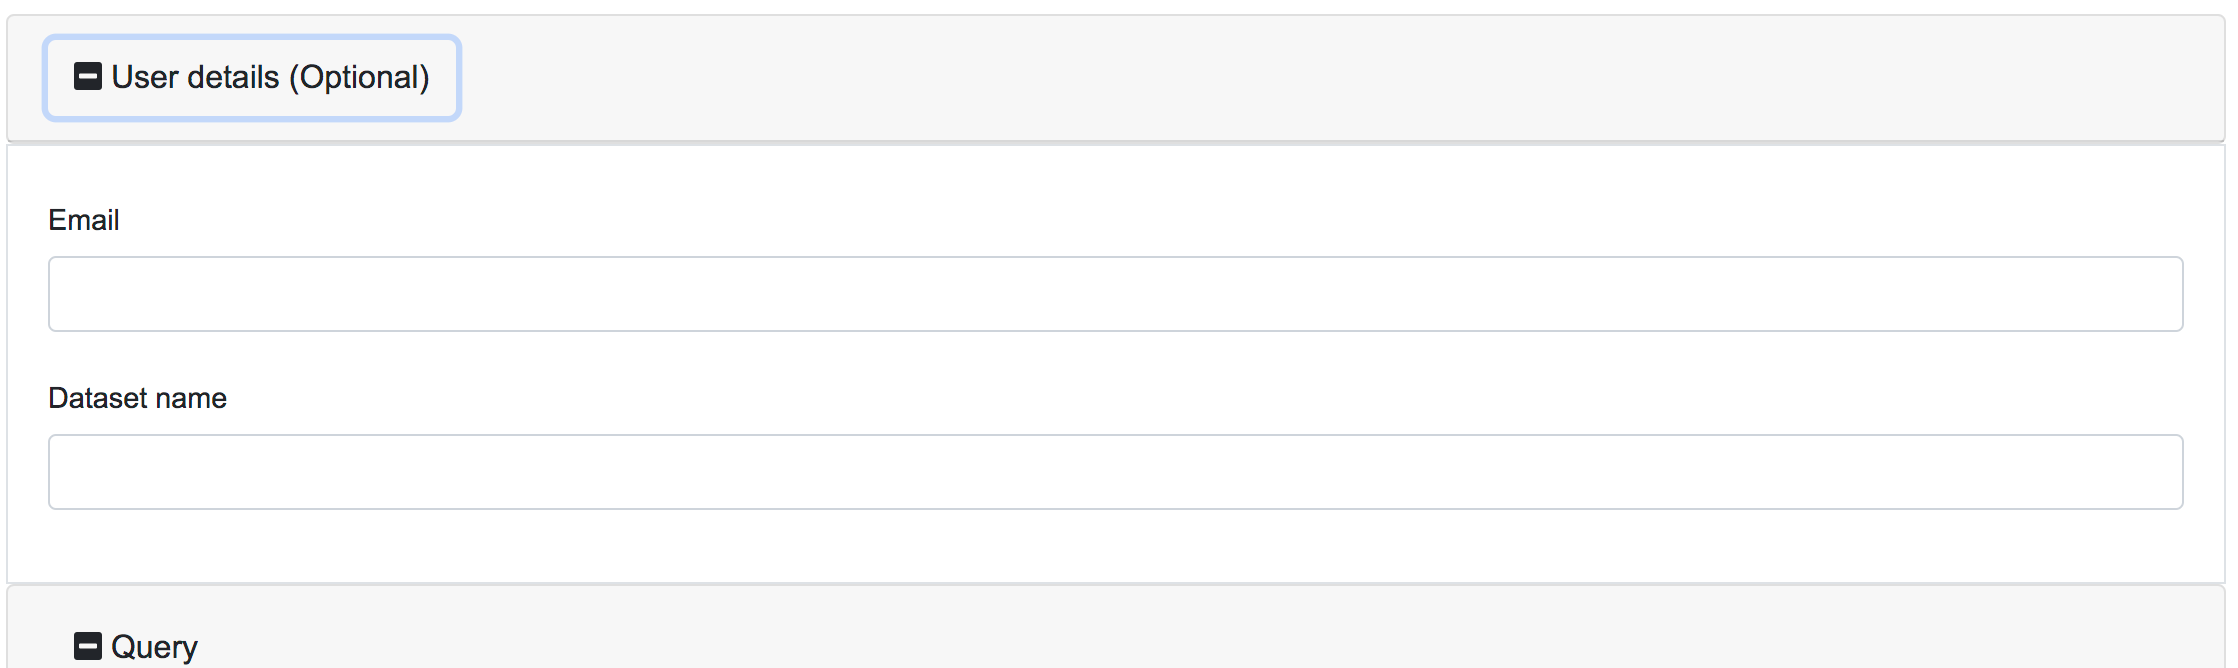
A user can provide the email address and a name for the query dataset. This is an optional requirement. If the user provides a valid email address, notification of acceptance and completion of their request are sent via email. The dataset name is useful for the users to keep track of the individual queries when multiple requests are submitted.
This option is shown initially collapsed. The user must click on the plus sign to show these options:
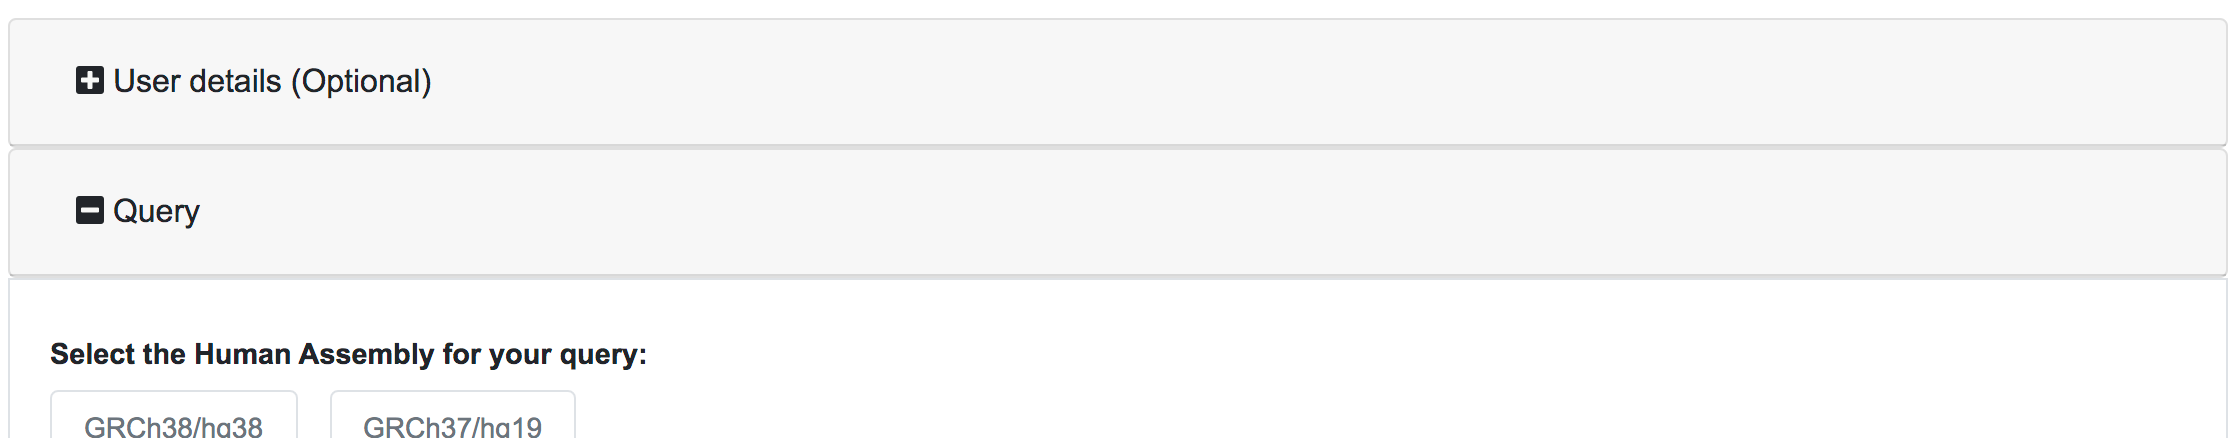
The first thing to do in every query is to select the correct Human Genome Assembly. SNPnexus currently supports the two latest human genome assemblies:
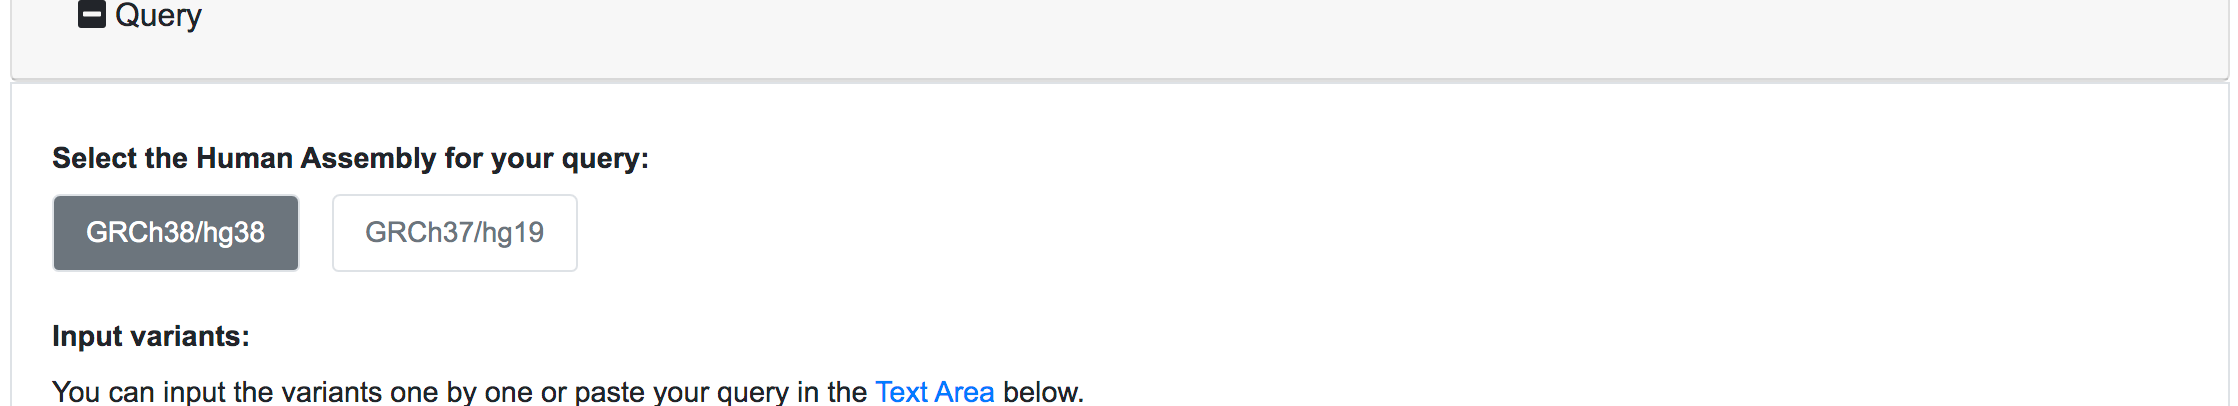
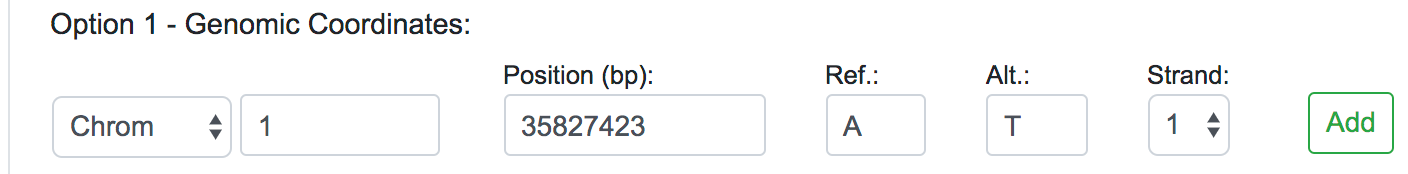
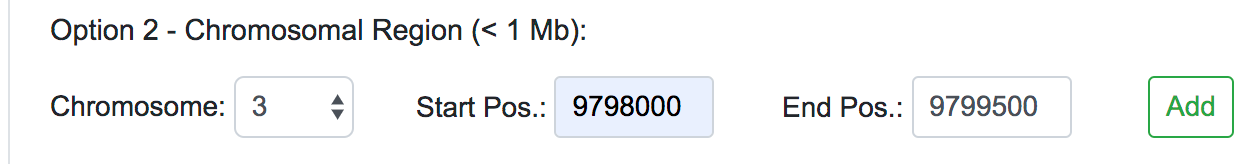
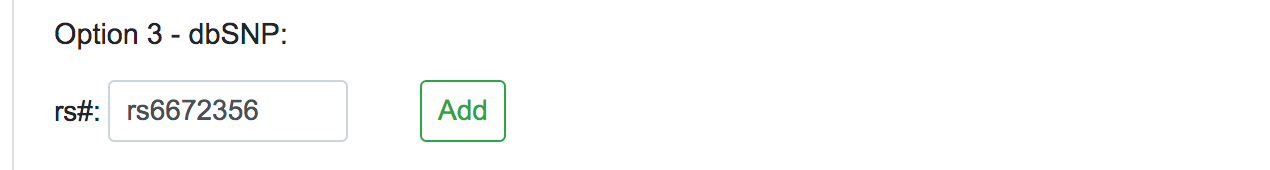
Once selected the Human Assembly, the query options will be shown. The variant data can be submitted in three different forms: genomic position, chromosomal region or dbSNP identifier. For each of these cases, the user should fill all the fields available and click on the Add button on the right. If the data entered is valid, the query will be copied into the text area below automatically. This would be the appropriate way to input single or a few numbers of SNPs or novel variants for a quick reassessment.
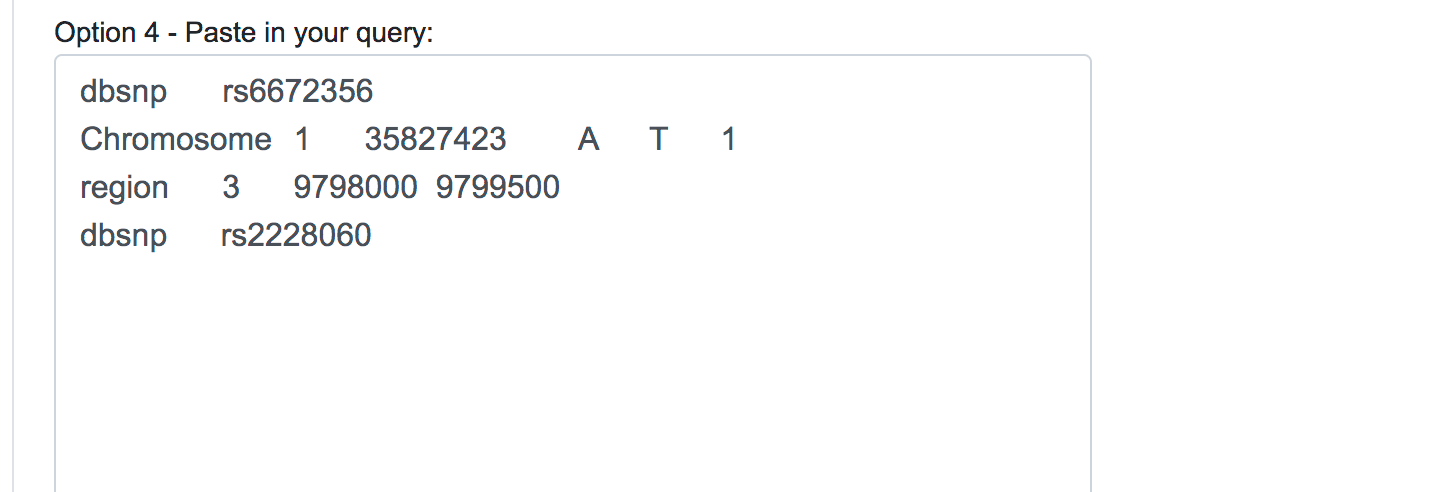
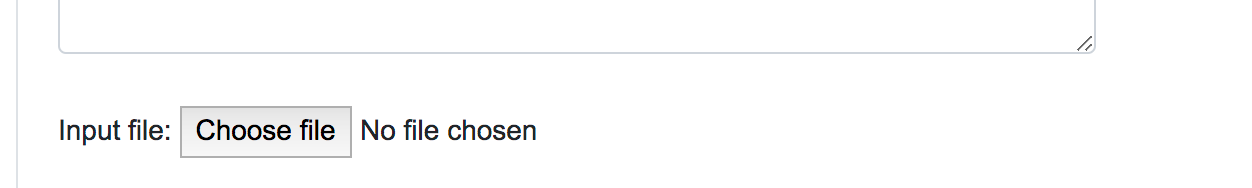
When dealing with large numbers of variations, a bath query is the suitable option. Users can either paste the variants list directly into the designated text area or upload a text file (.txt) containing the query variants. Currently, we limit the maximum number of variants in a single batch query to 100,000. Alternatively, users can upload VCF files (.vcf), containing SNPs, InDels and Block substitutions. The maximum size for the uploaded file is 20 Mb.
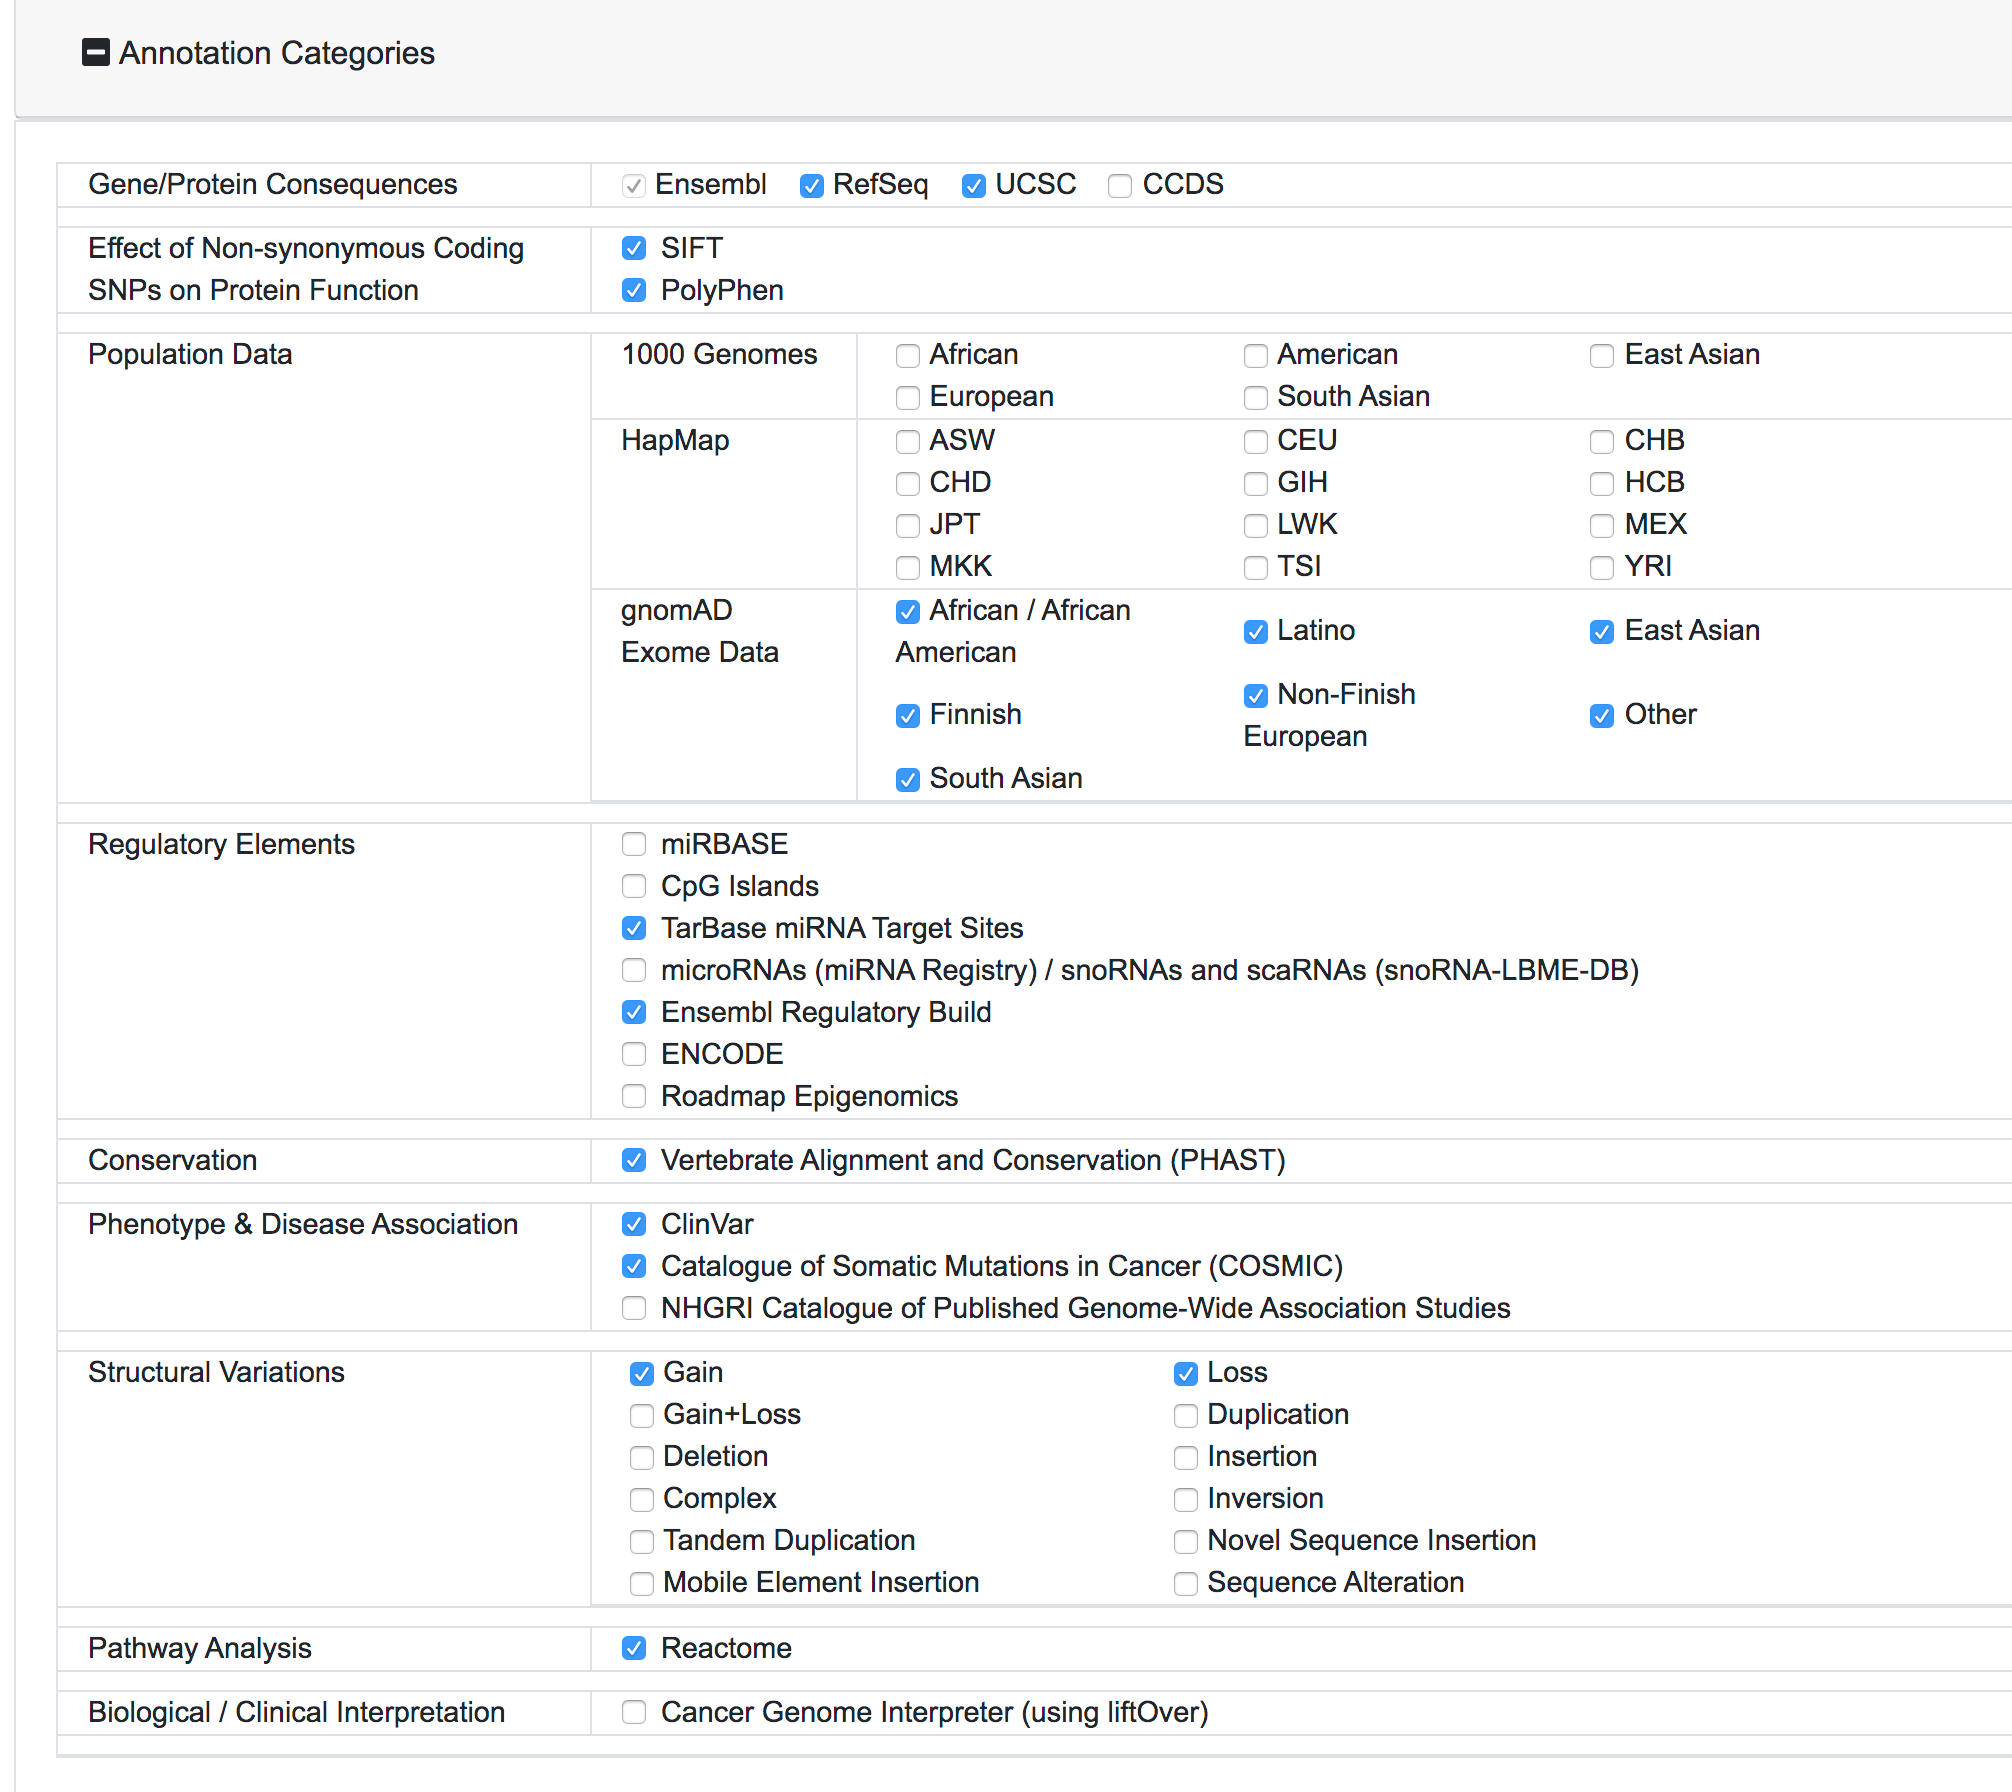
Once the user selects the appropriate human genome assembly, the list of annotation categories available for that human assembly will be shown. In this example, various annotation categories are selected for the GRCh38/hg38 assembly.
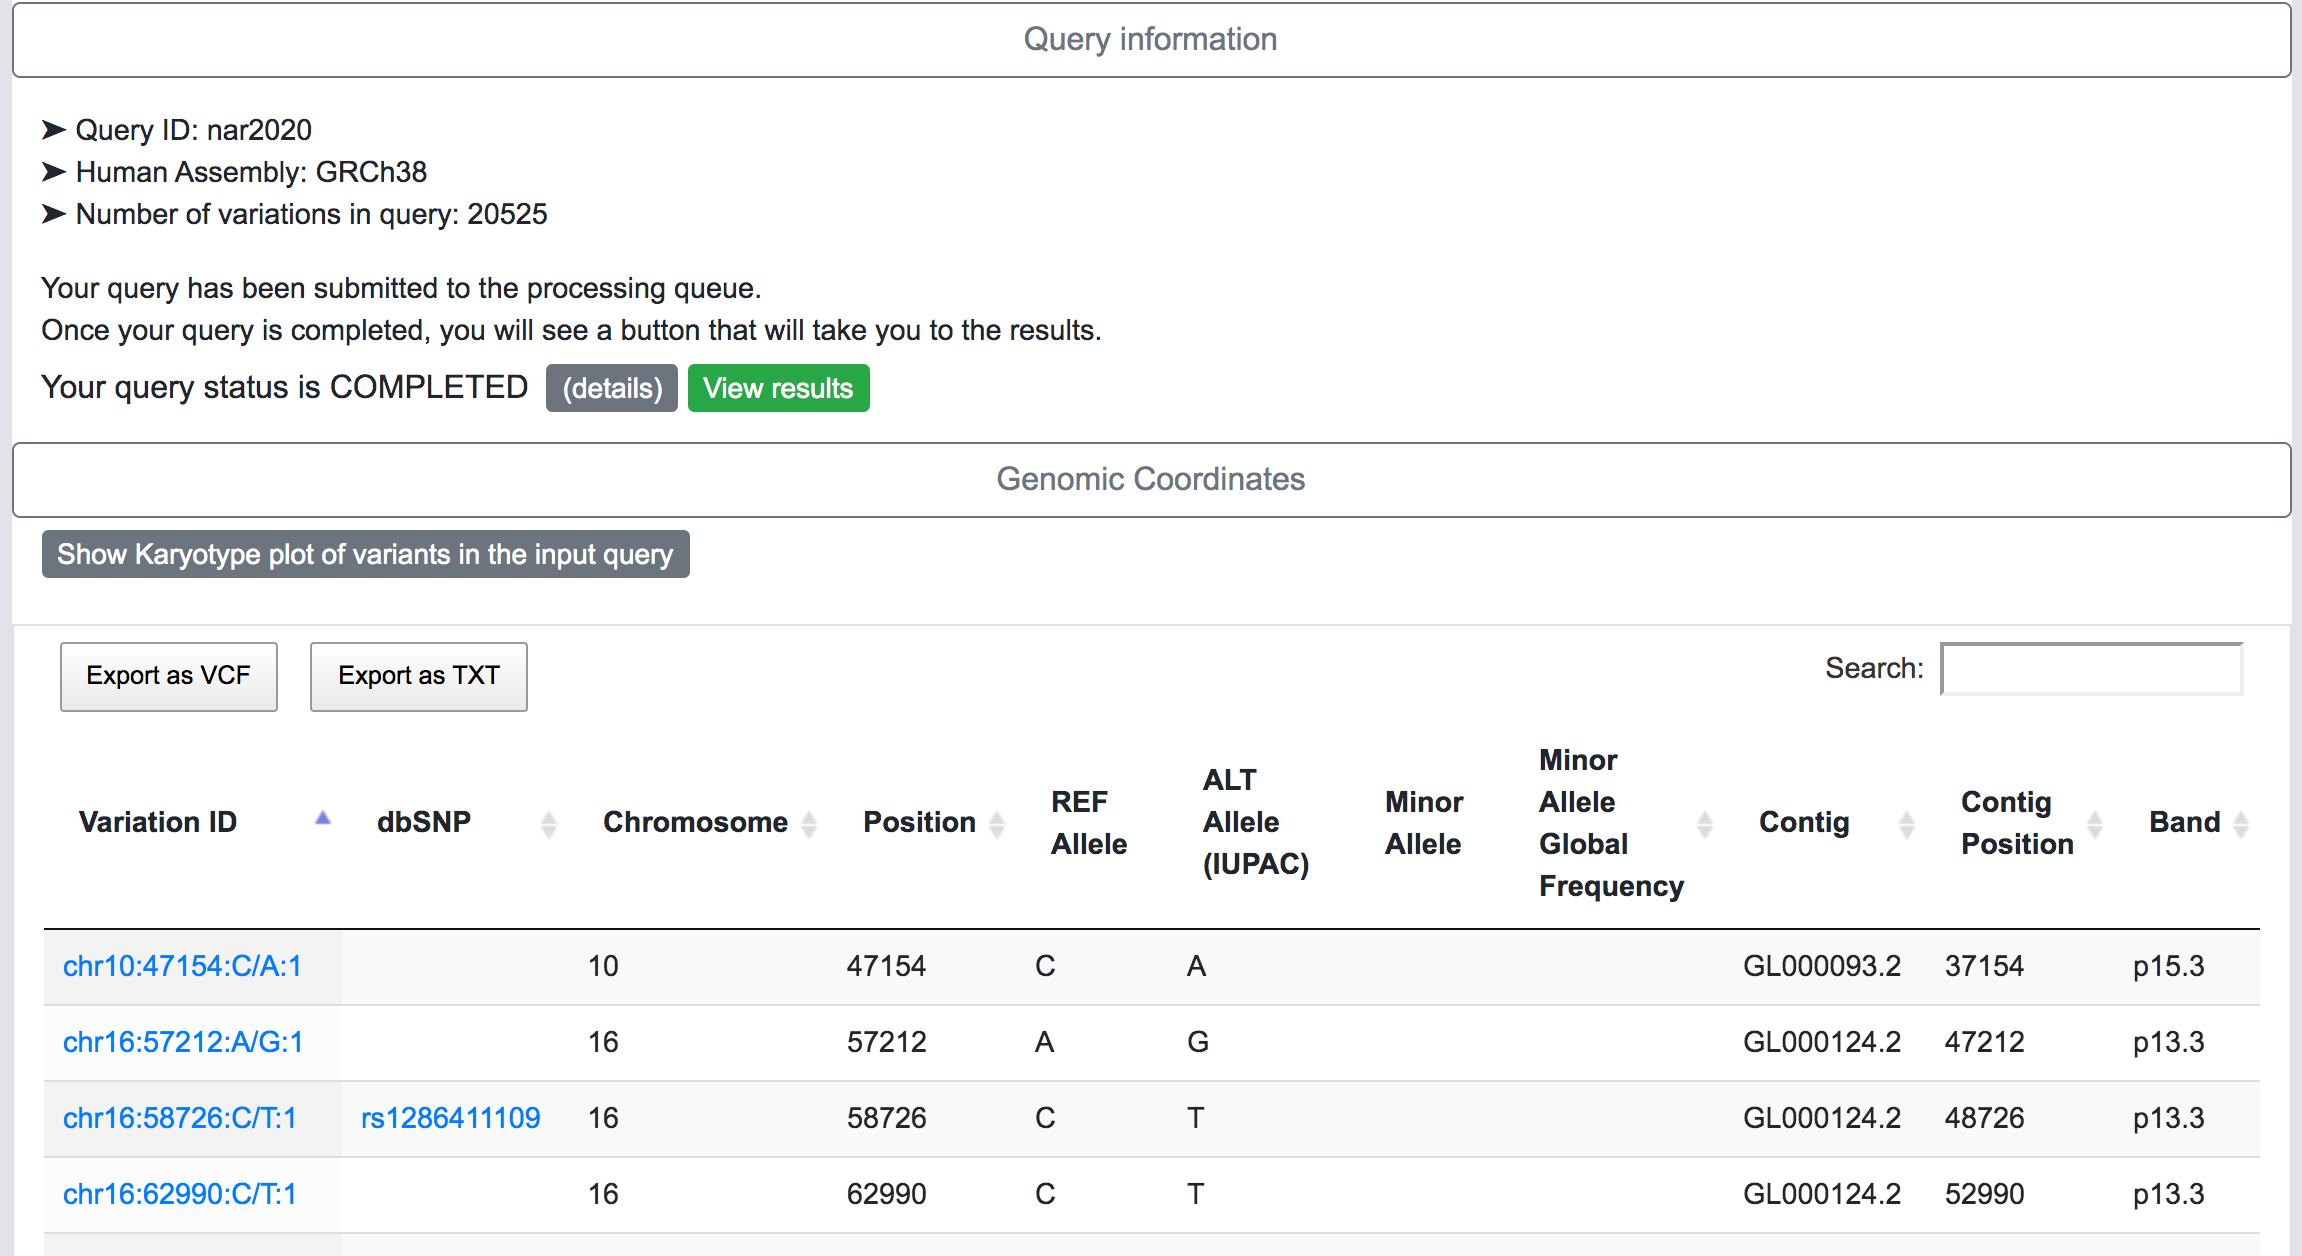
Once the request is submitted, the variants are preprocessed, mapped and added to the processing queue. SNPnexus will show a page with a summary of the query and the current status of the process:
SNPnexus will assign a unique Identified for this query and this will be shown as part of the query information (Query ID). The user can return to this page at any moment via https://snp-nexus.org/[queryId]/
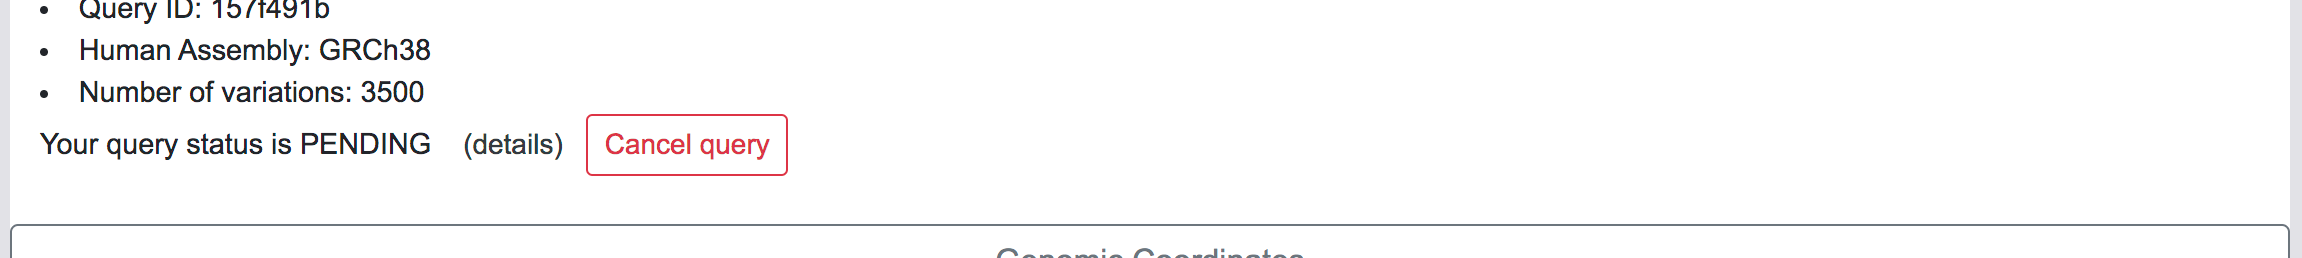
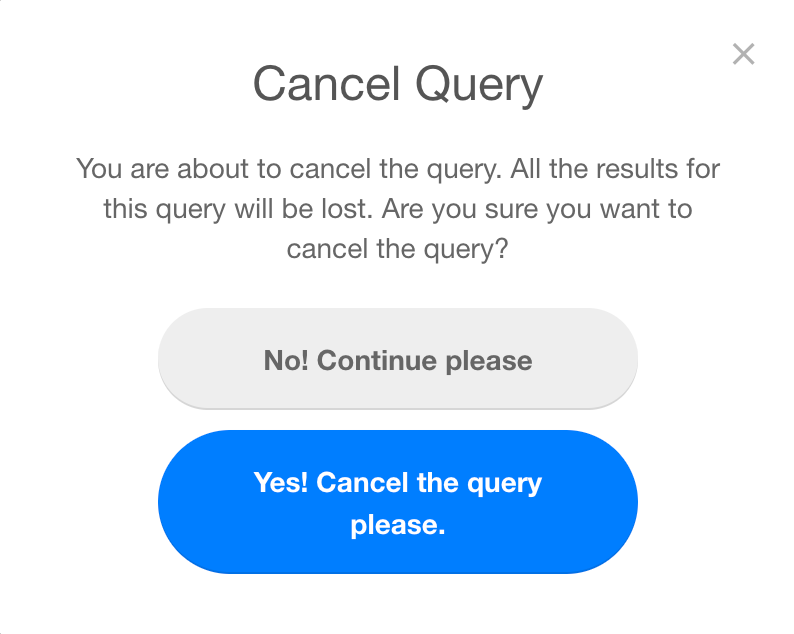
While the query is in the PENDING or PROCESSING status, it is possible for the user to Cancel the request. Once a process is cancelled, all the results will be lost and it is not possible to recover them. The user will be asked for a confirmation before proceeding to cancel the query.
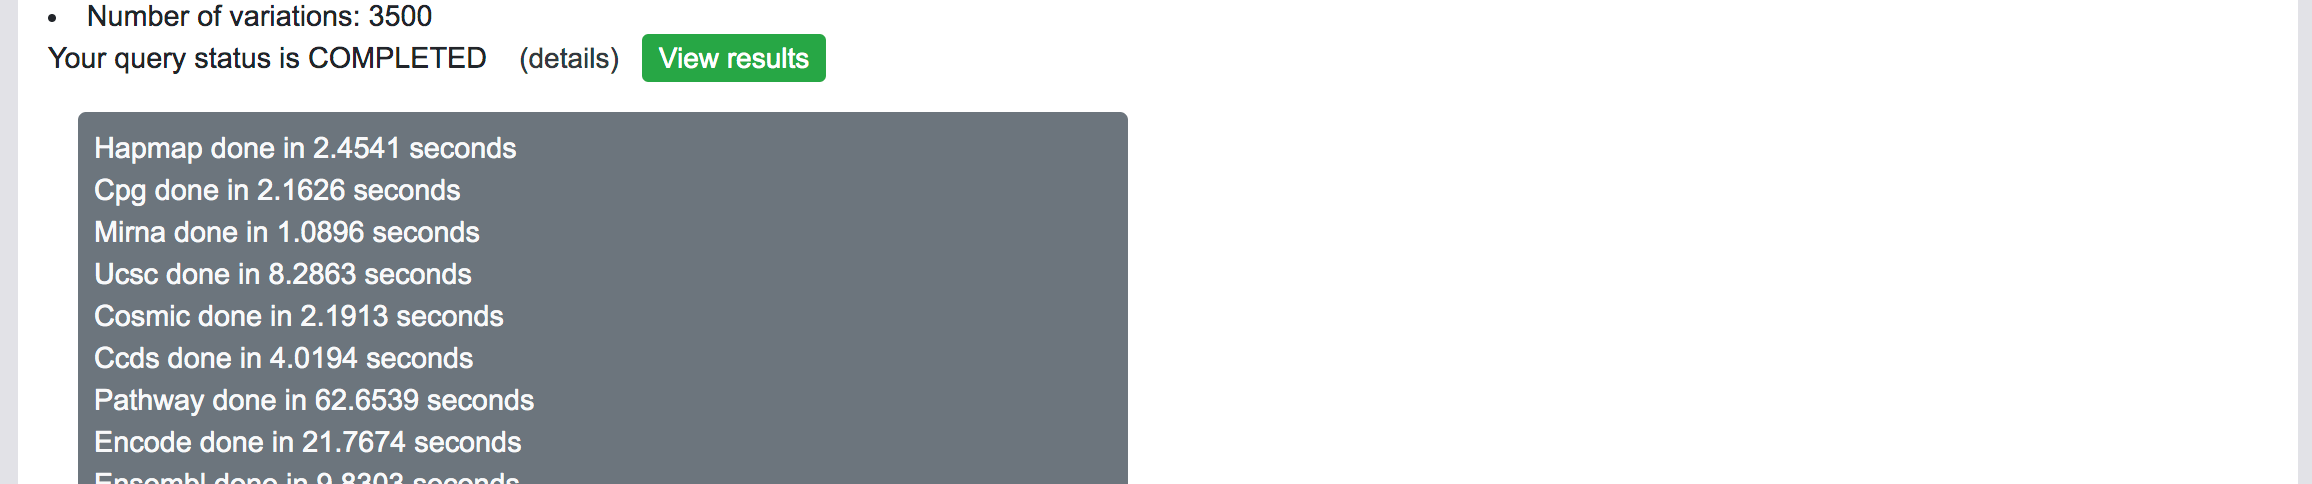
When the query is in the PROCESSING or COMPLETED status, the user can click in the details button and have some information about the annotation process.
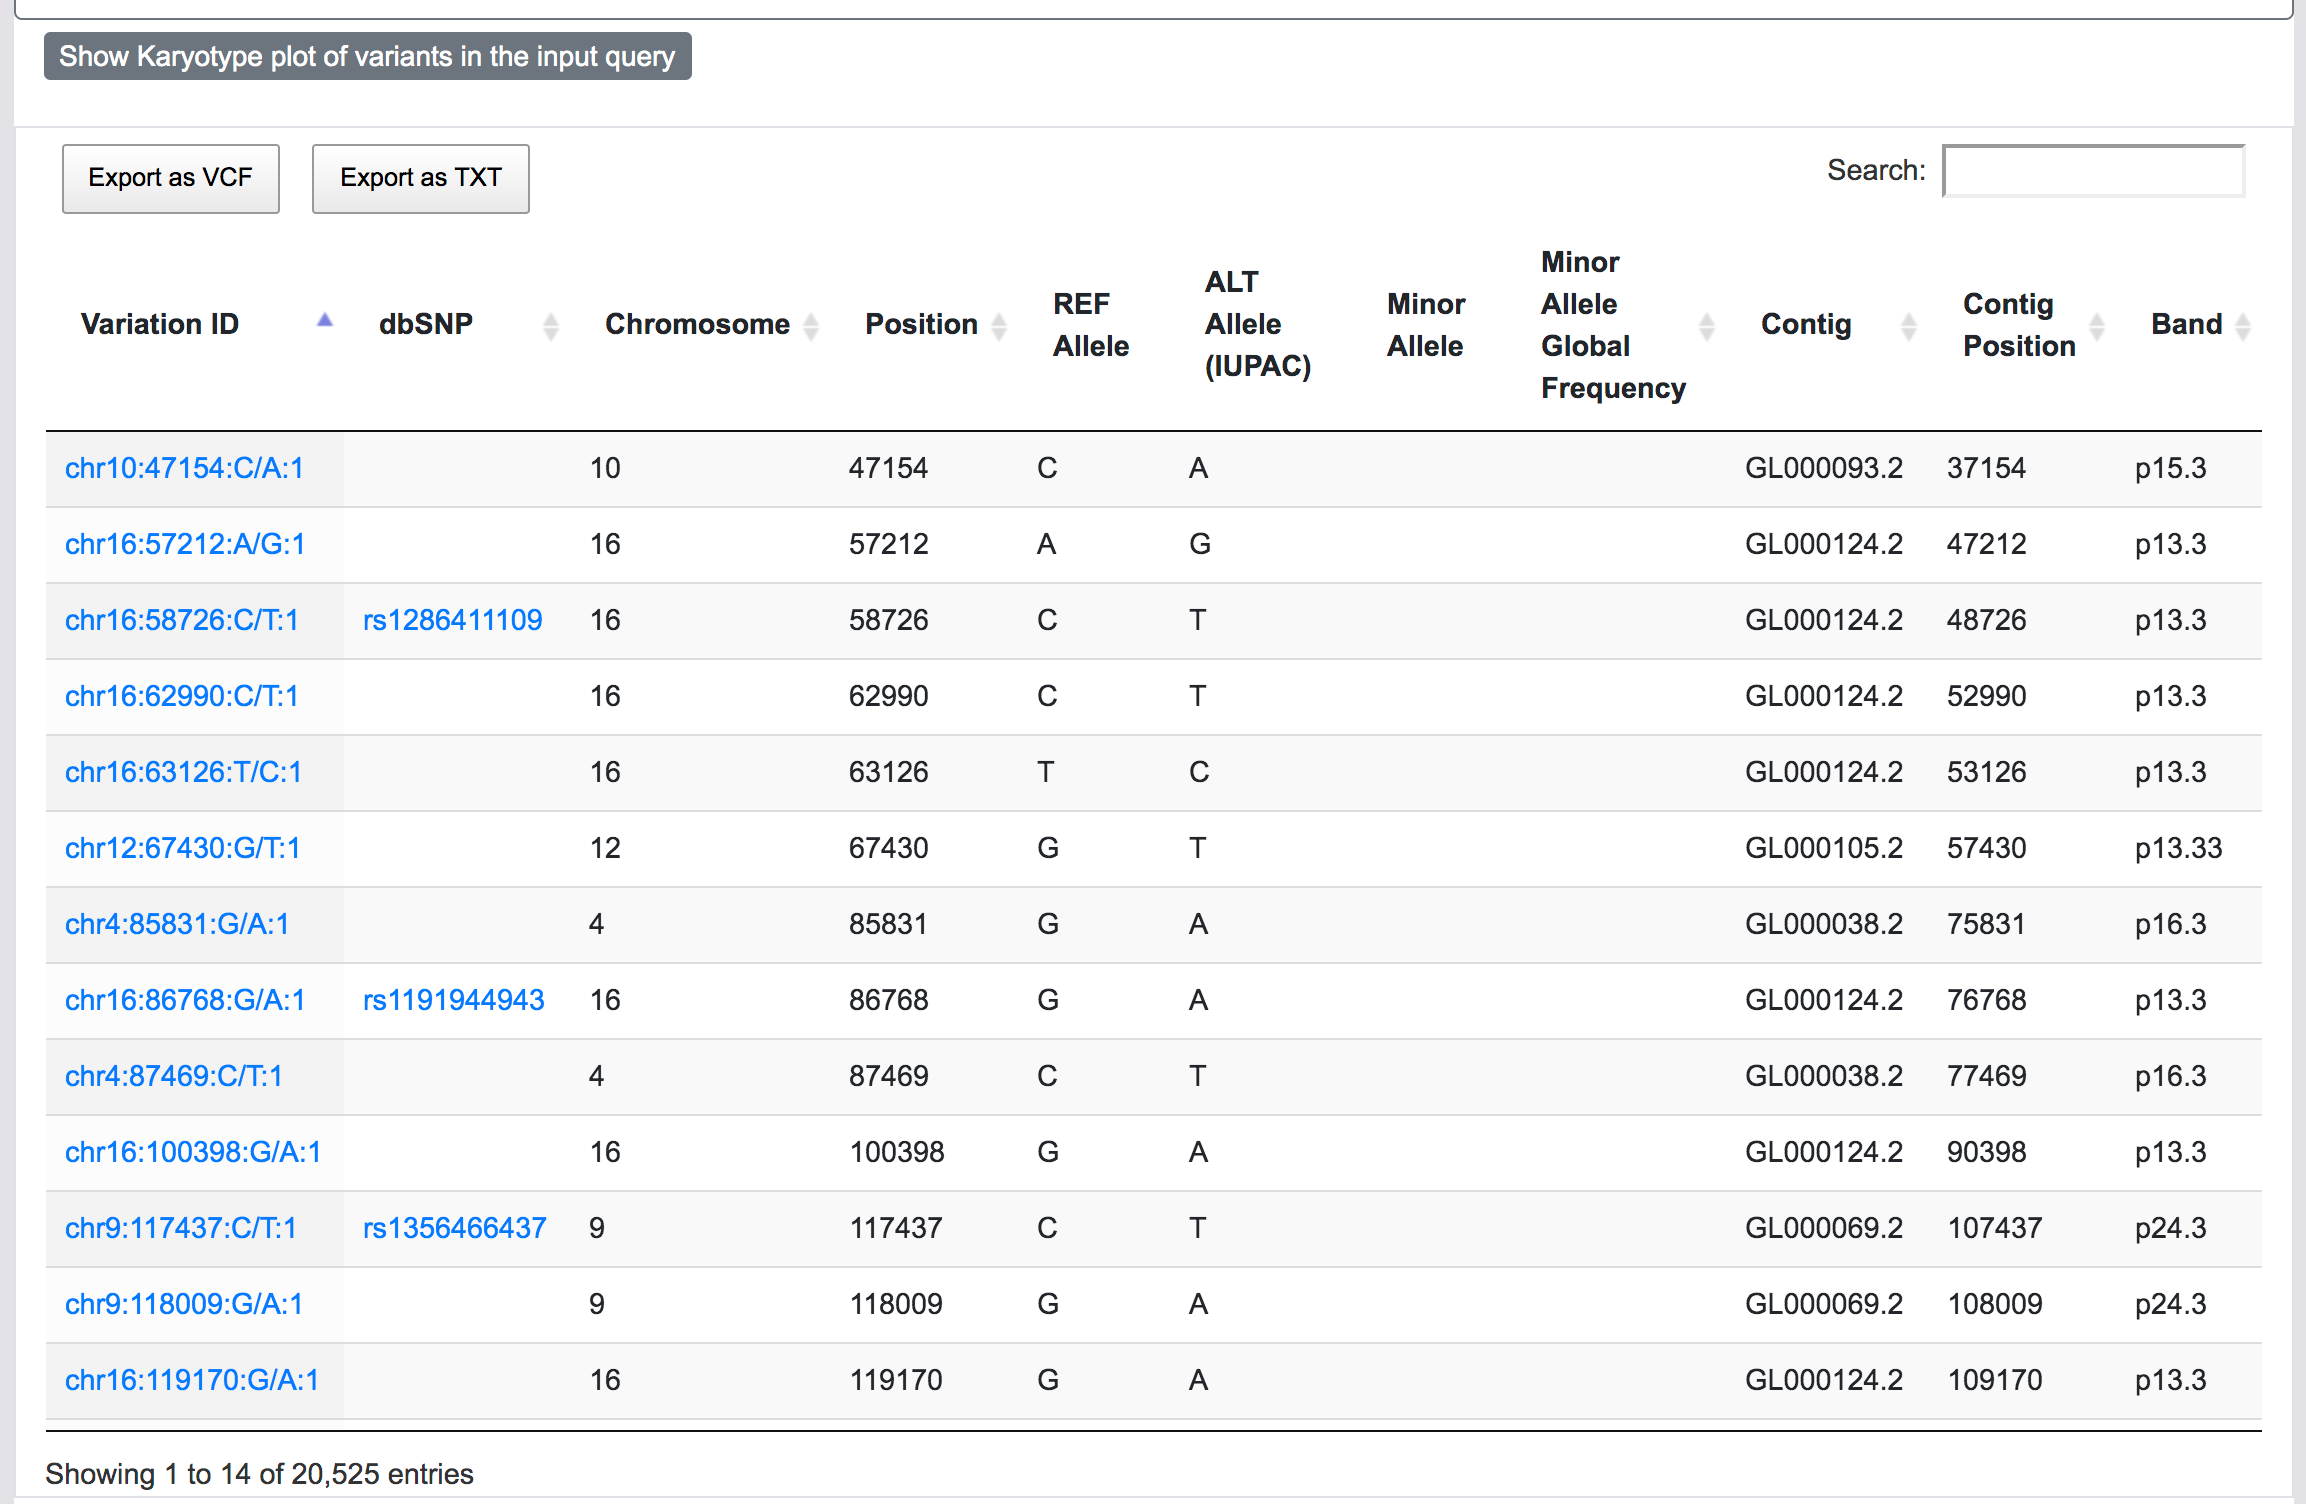
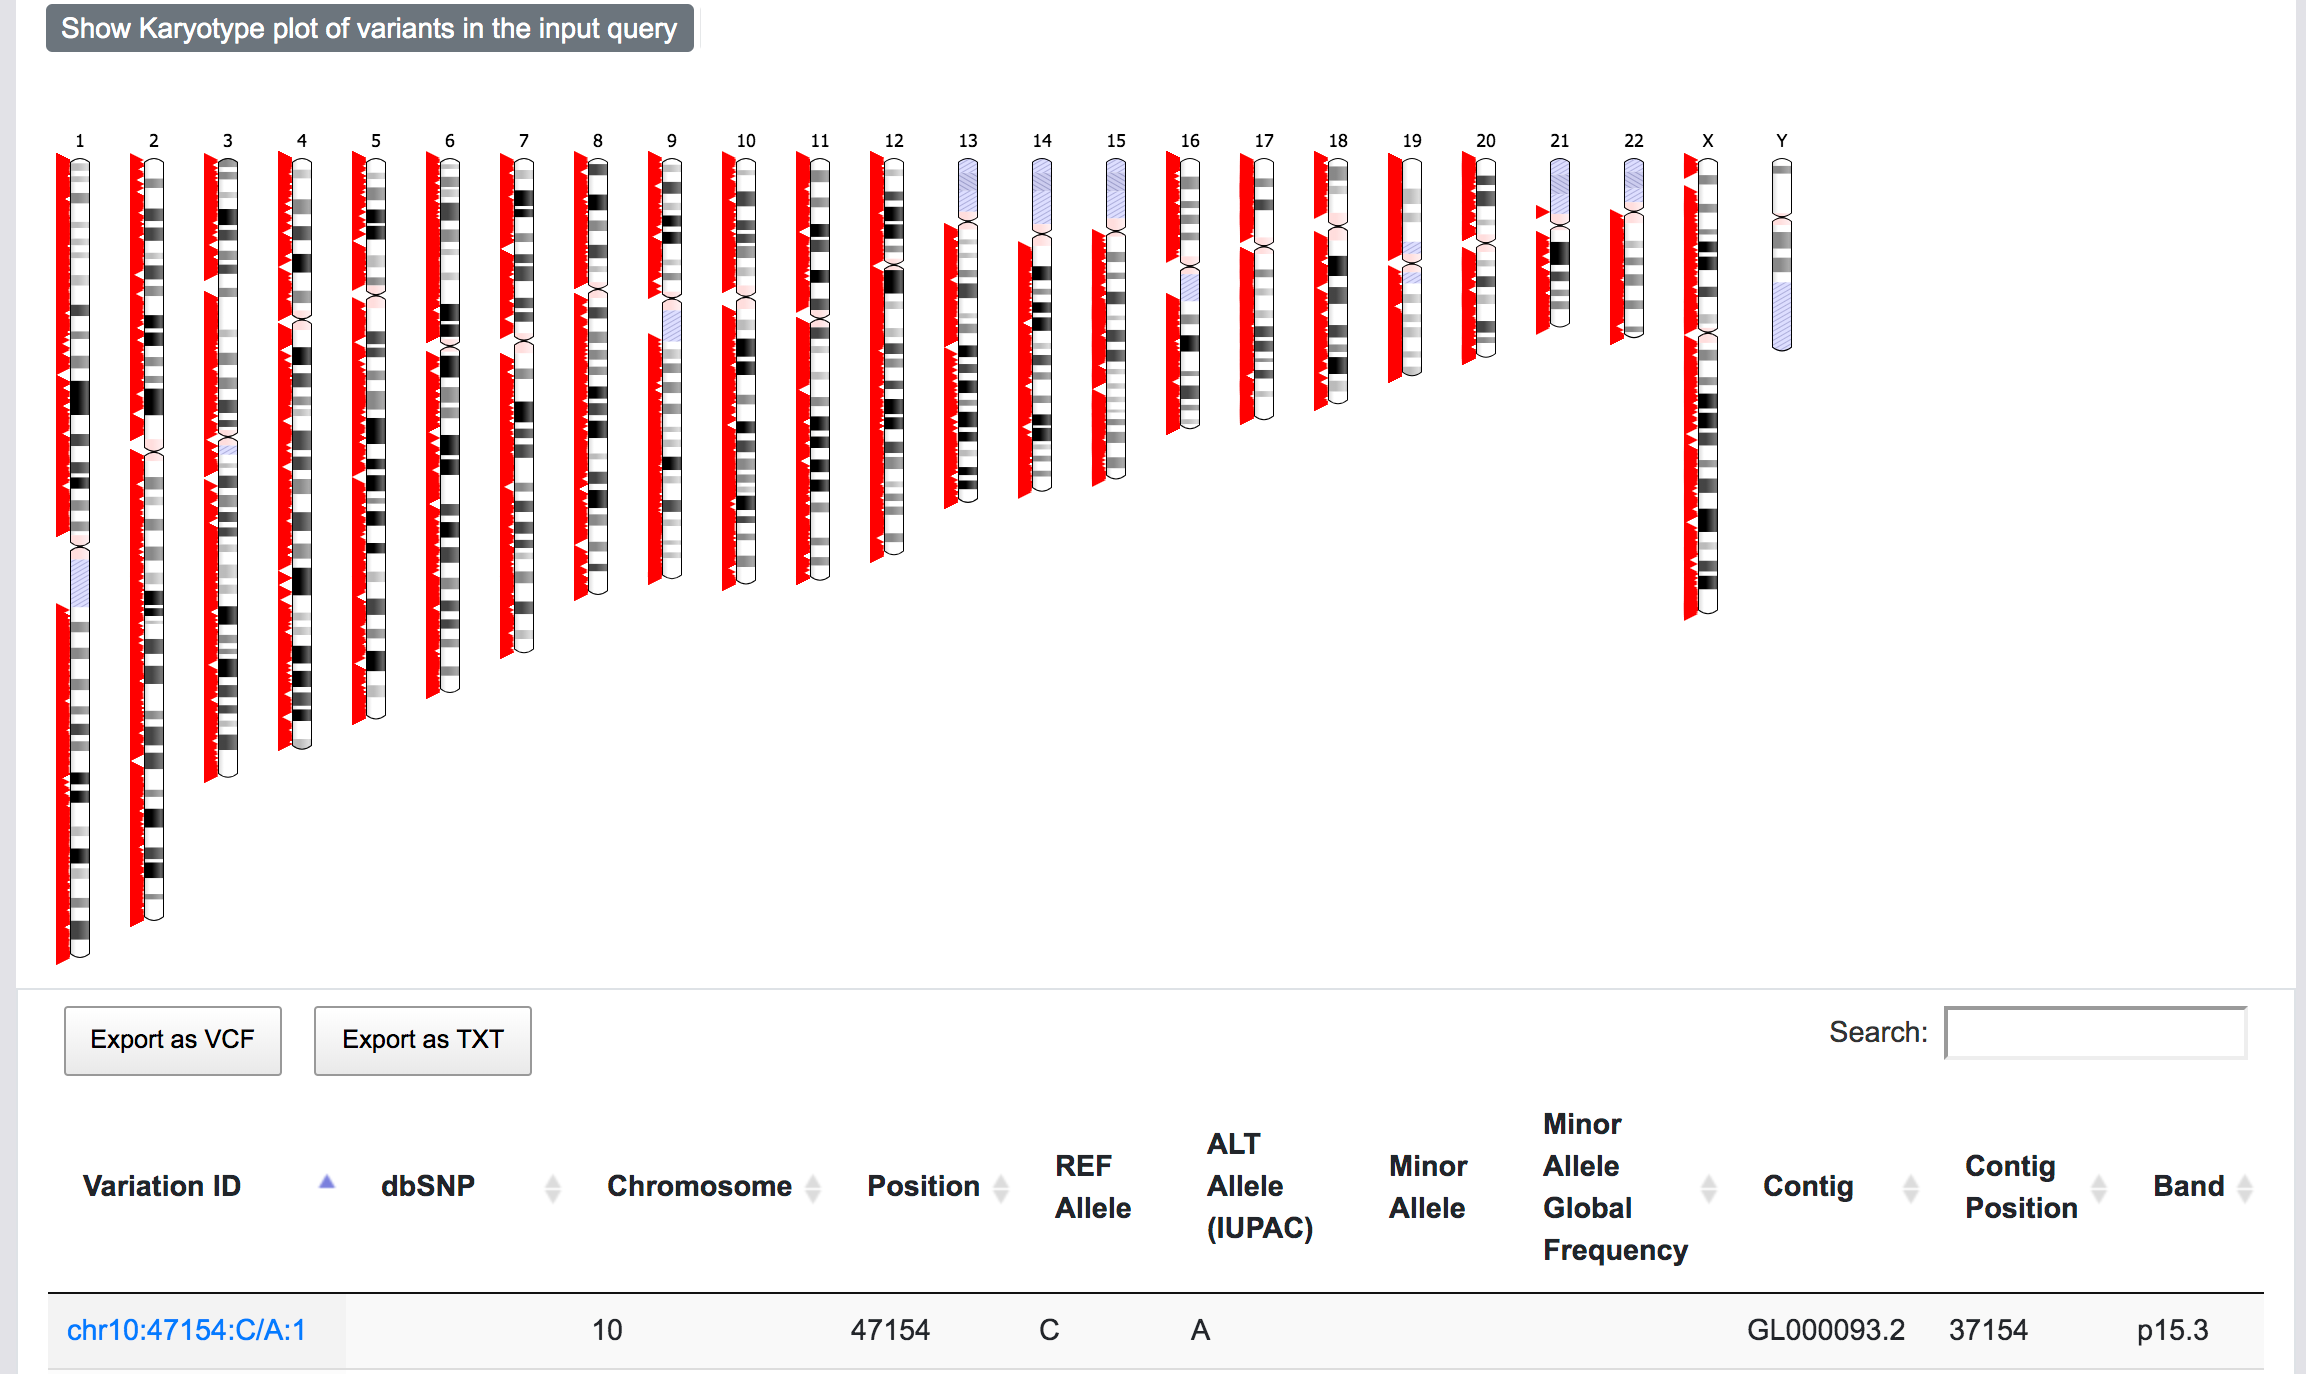
At this stage, SNPnexus presents a table with the genomic coordinates and dbSNP mapping of the query. The user can explore the data and export this table as VCF or text file. Furthermore, SNPnexus can present the data as a Karyotype plot to give the user an idea of the locations of the variants in the queryset.
Finally, once the process is completed, the user can click on the "View results" button to be directed to the results page.
The results page is divided into two main sections, and each of these have corresponding sub-sections:
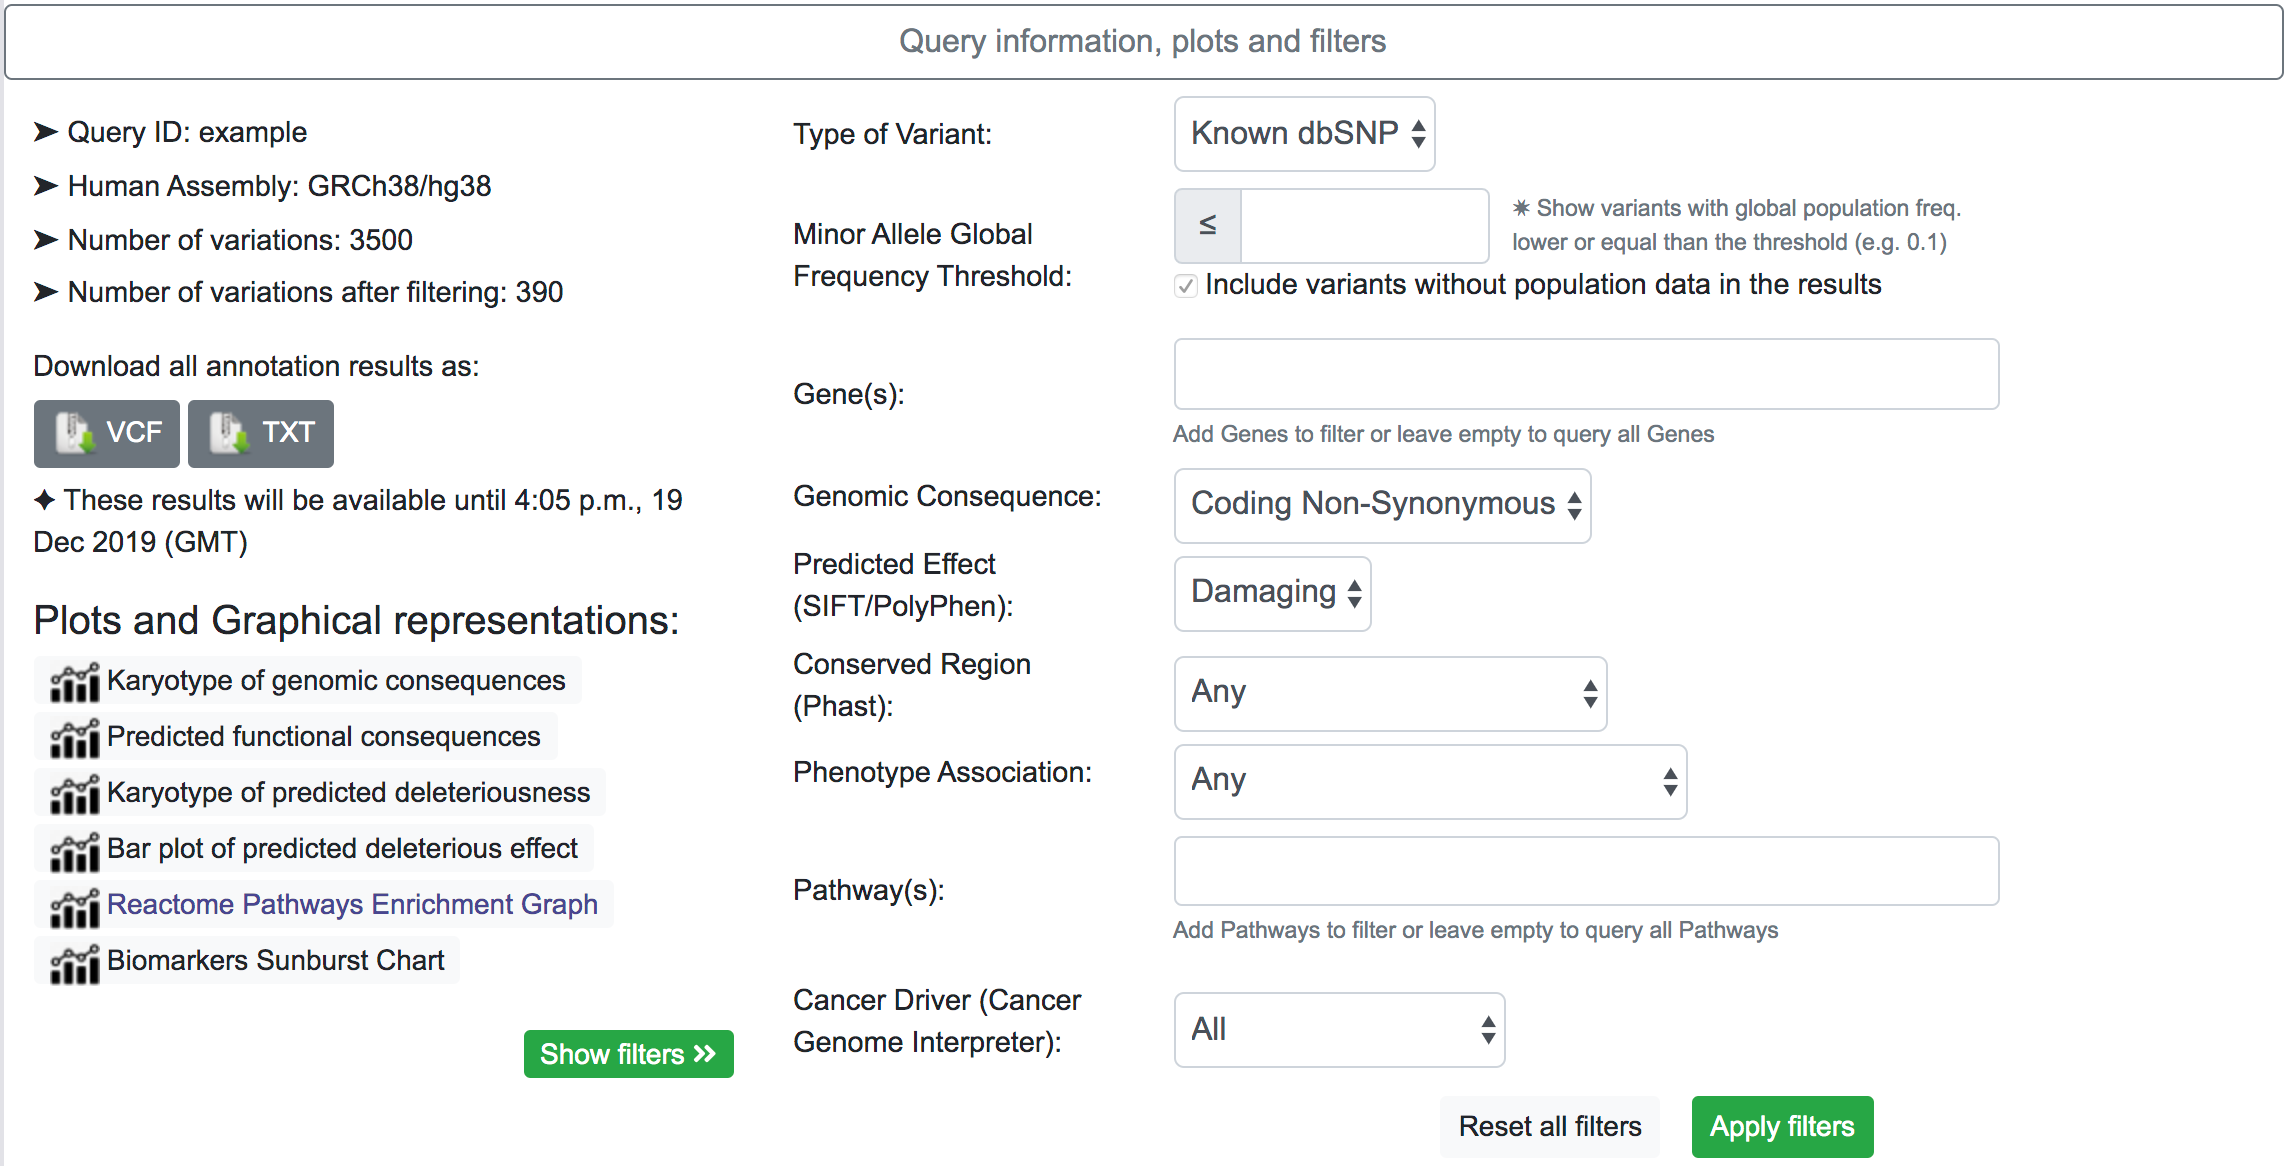
Query Information, plots and filters
This section shows basic information about the query, the human genome assembly, the number of variants in the original queryset and gives some options to the user.
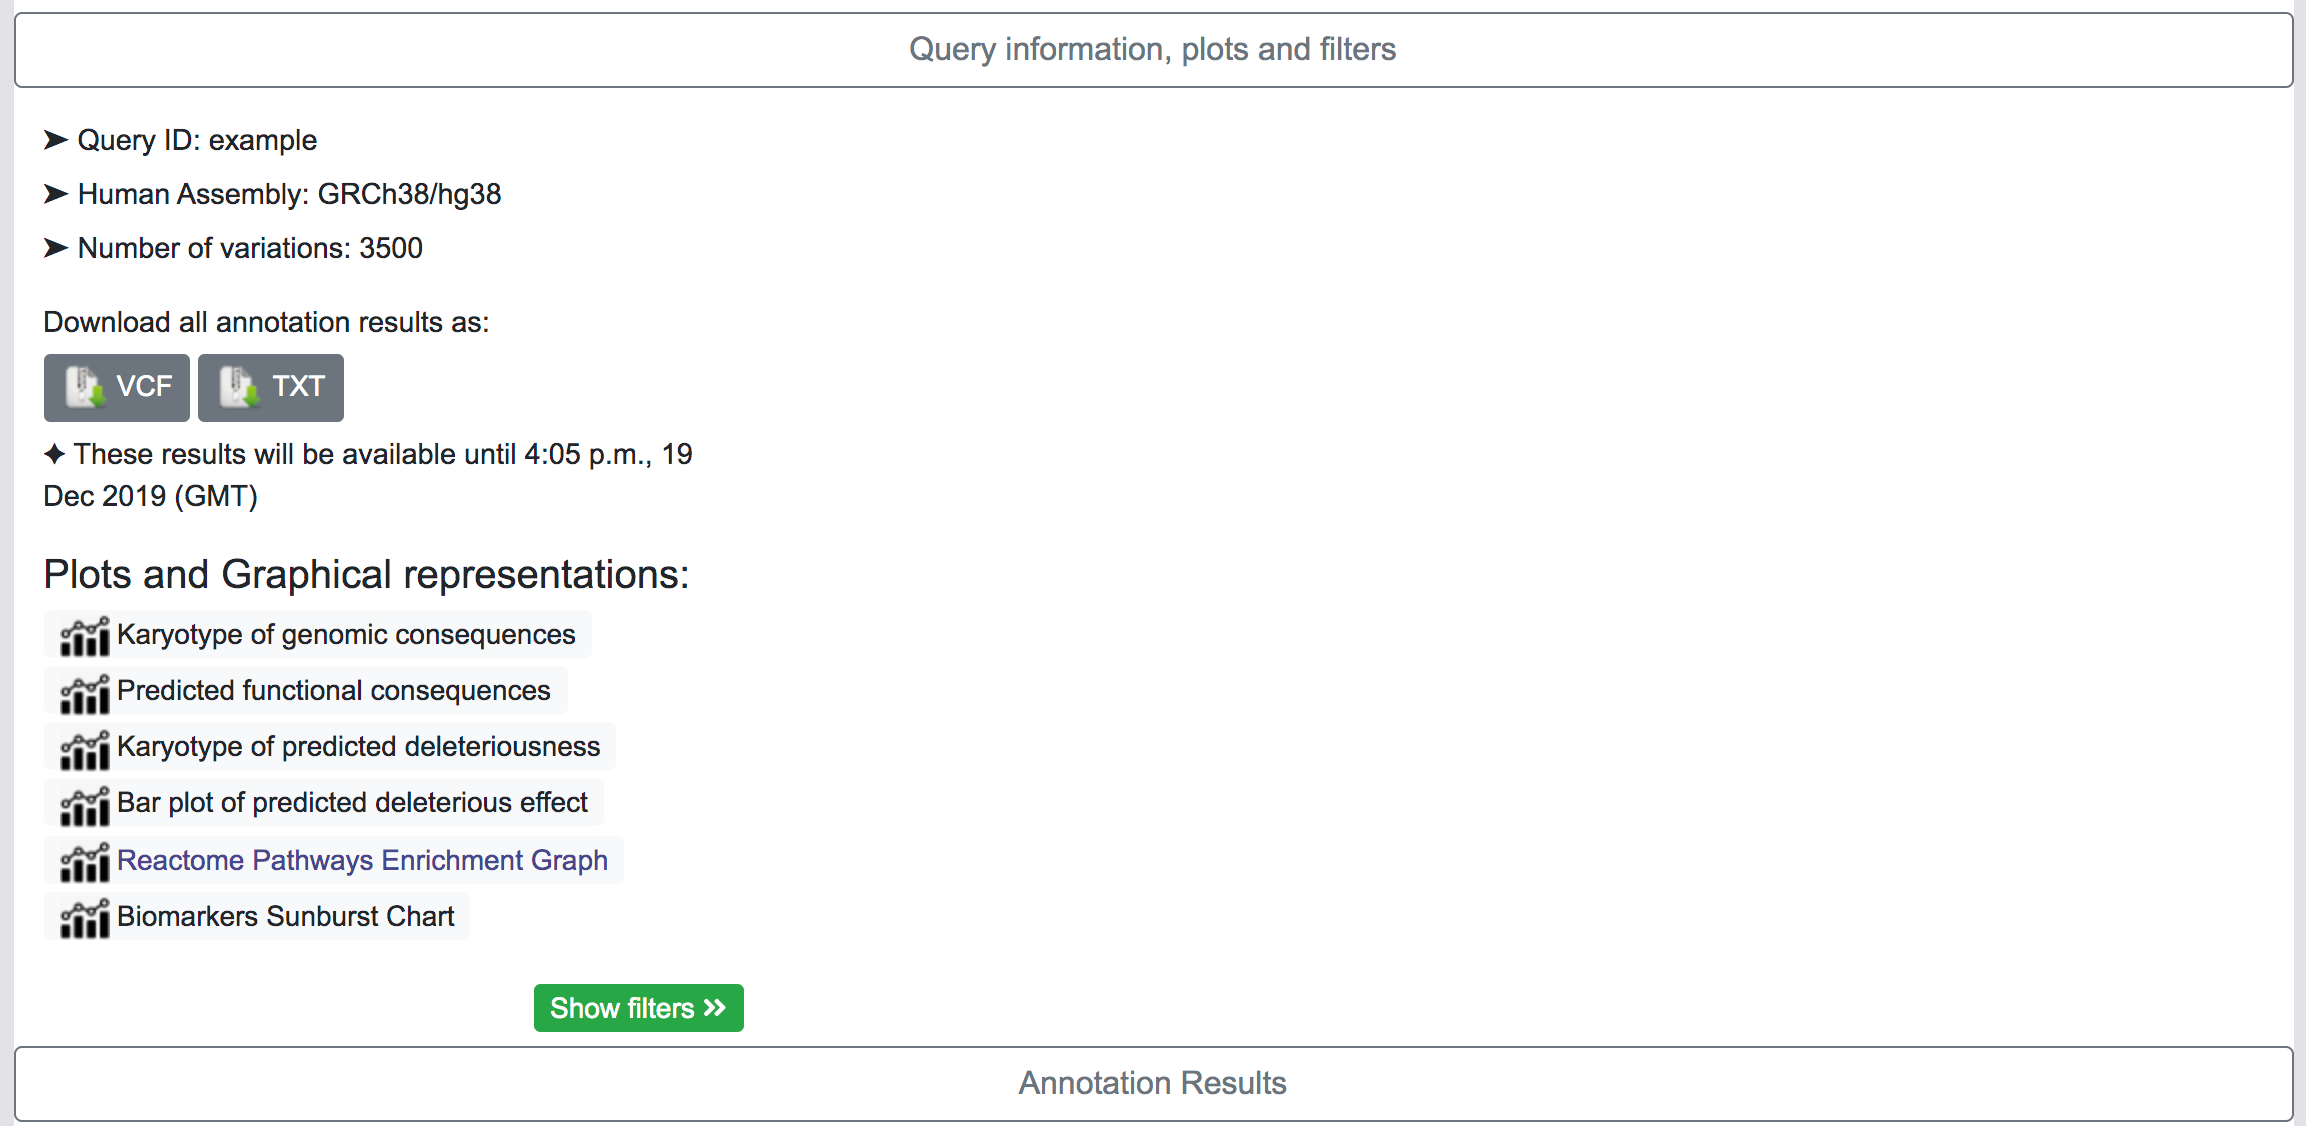
By clicking on the corresponding button, the user has the option to download all the results as VCF files or as Tab-separated files. This process may take some time depending on the number of variants in the queryset and the number of annotation categories selected in the original query. There is a also an option to download all annotations per variant in a single Tab-separated file.
Plots and graphical representation
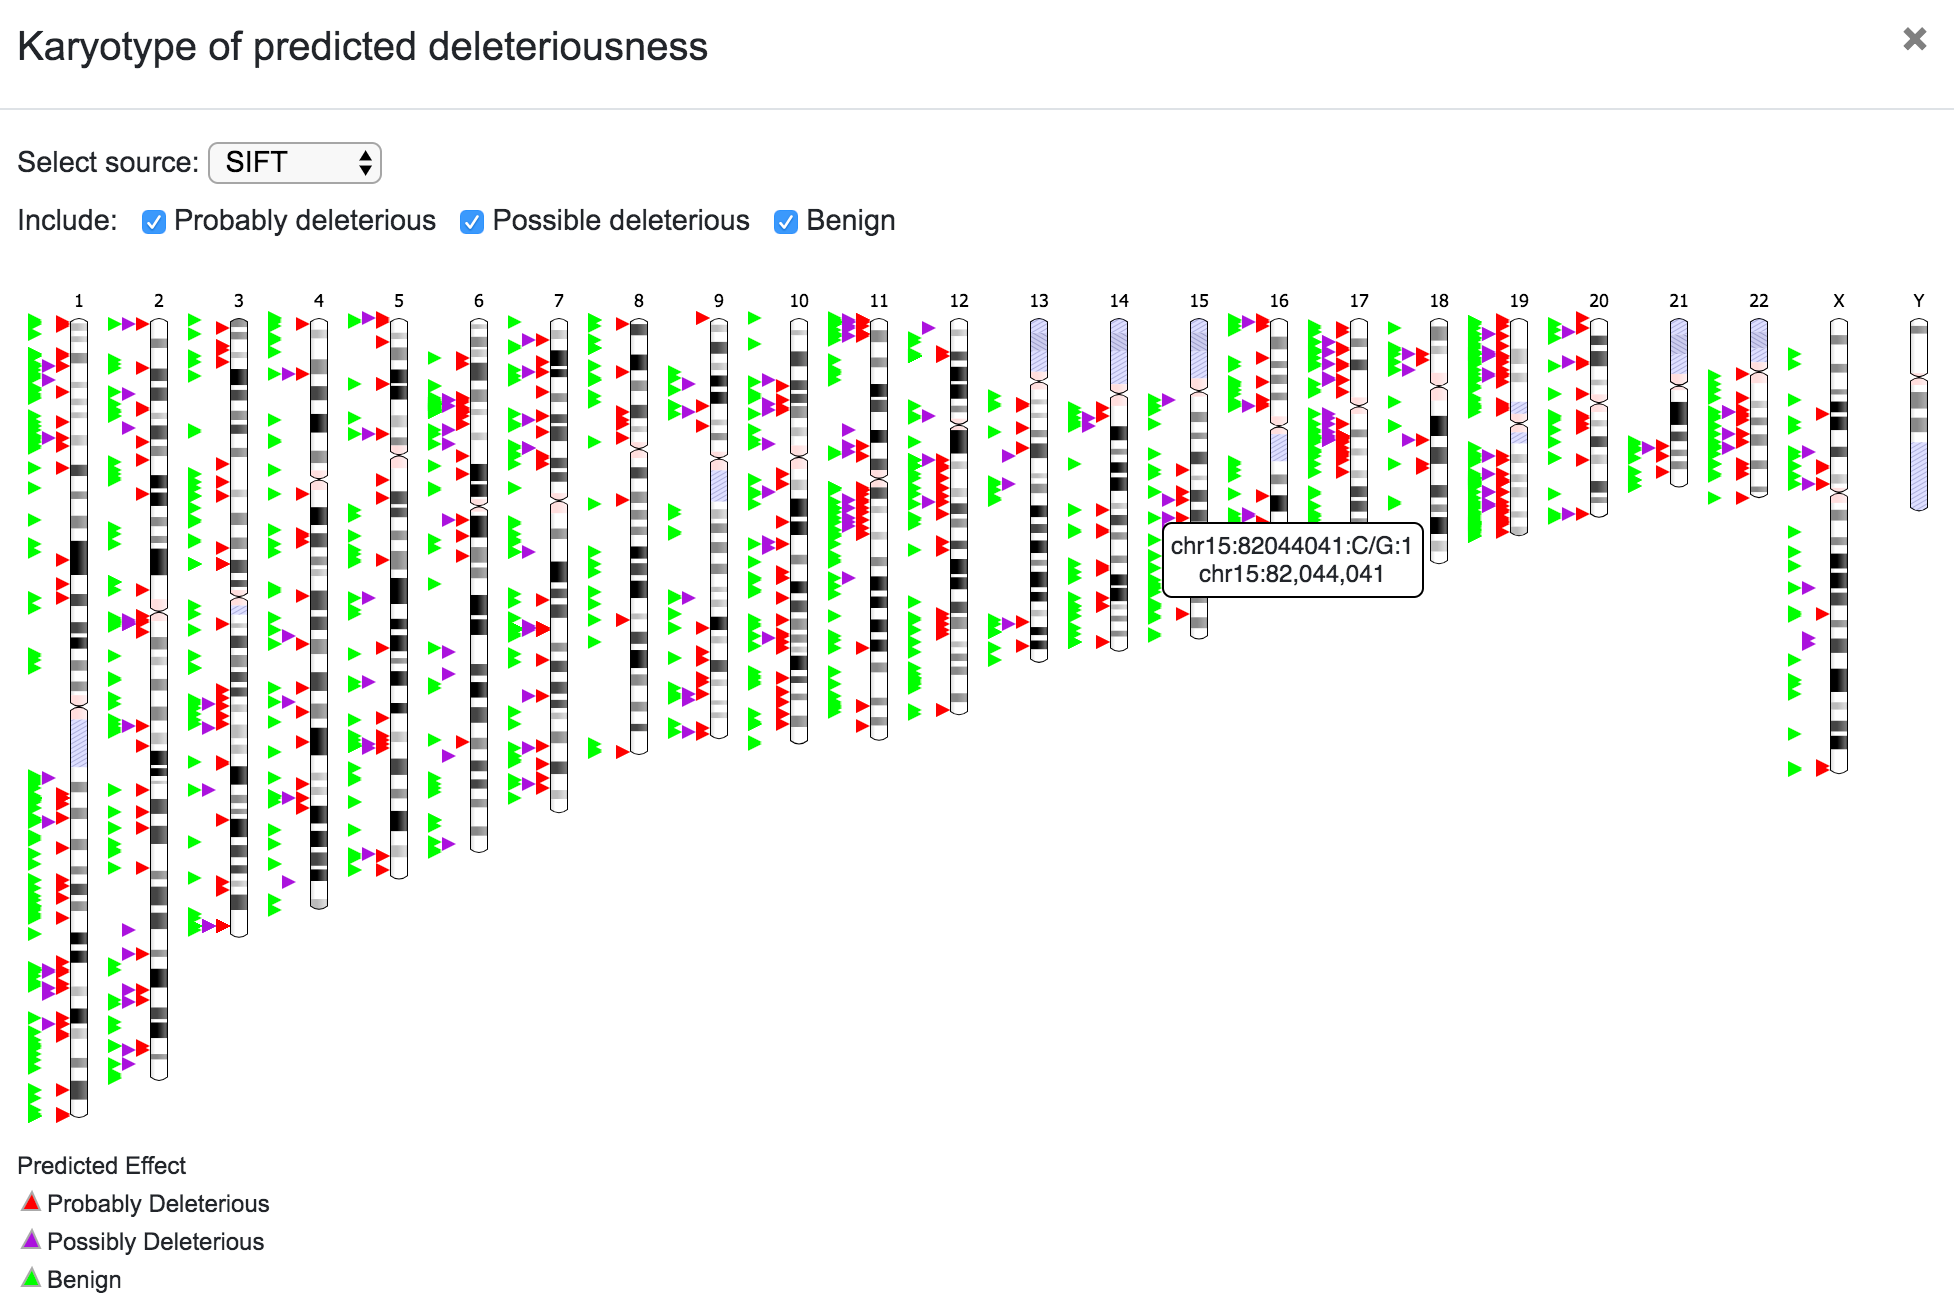
SNPnexus presents different graphical representations that will allow the user to quickly inspect the distribution and locations of the variants and the predicted functional consequences. Additionally, if the user requested for the SIFT or PolyPhen annotations, the tool creates two additional graphs showing the predicted deleterious effect of the variants.
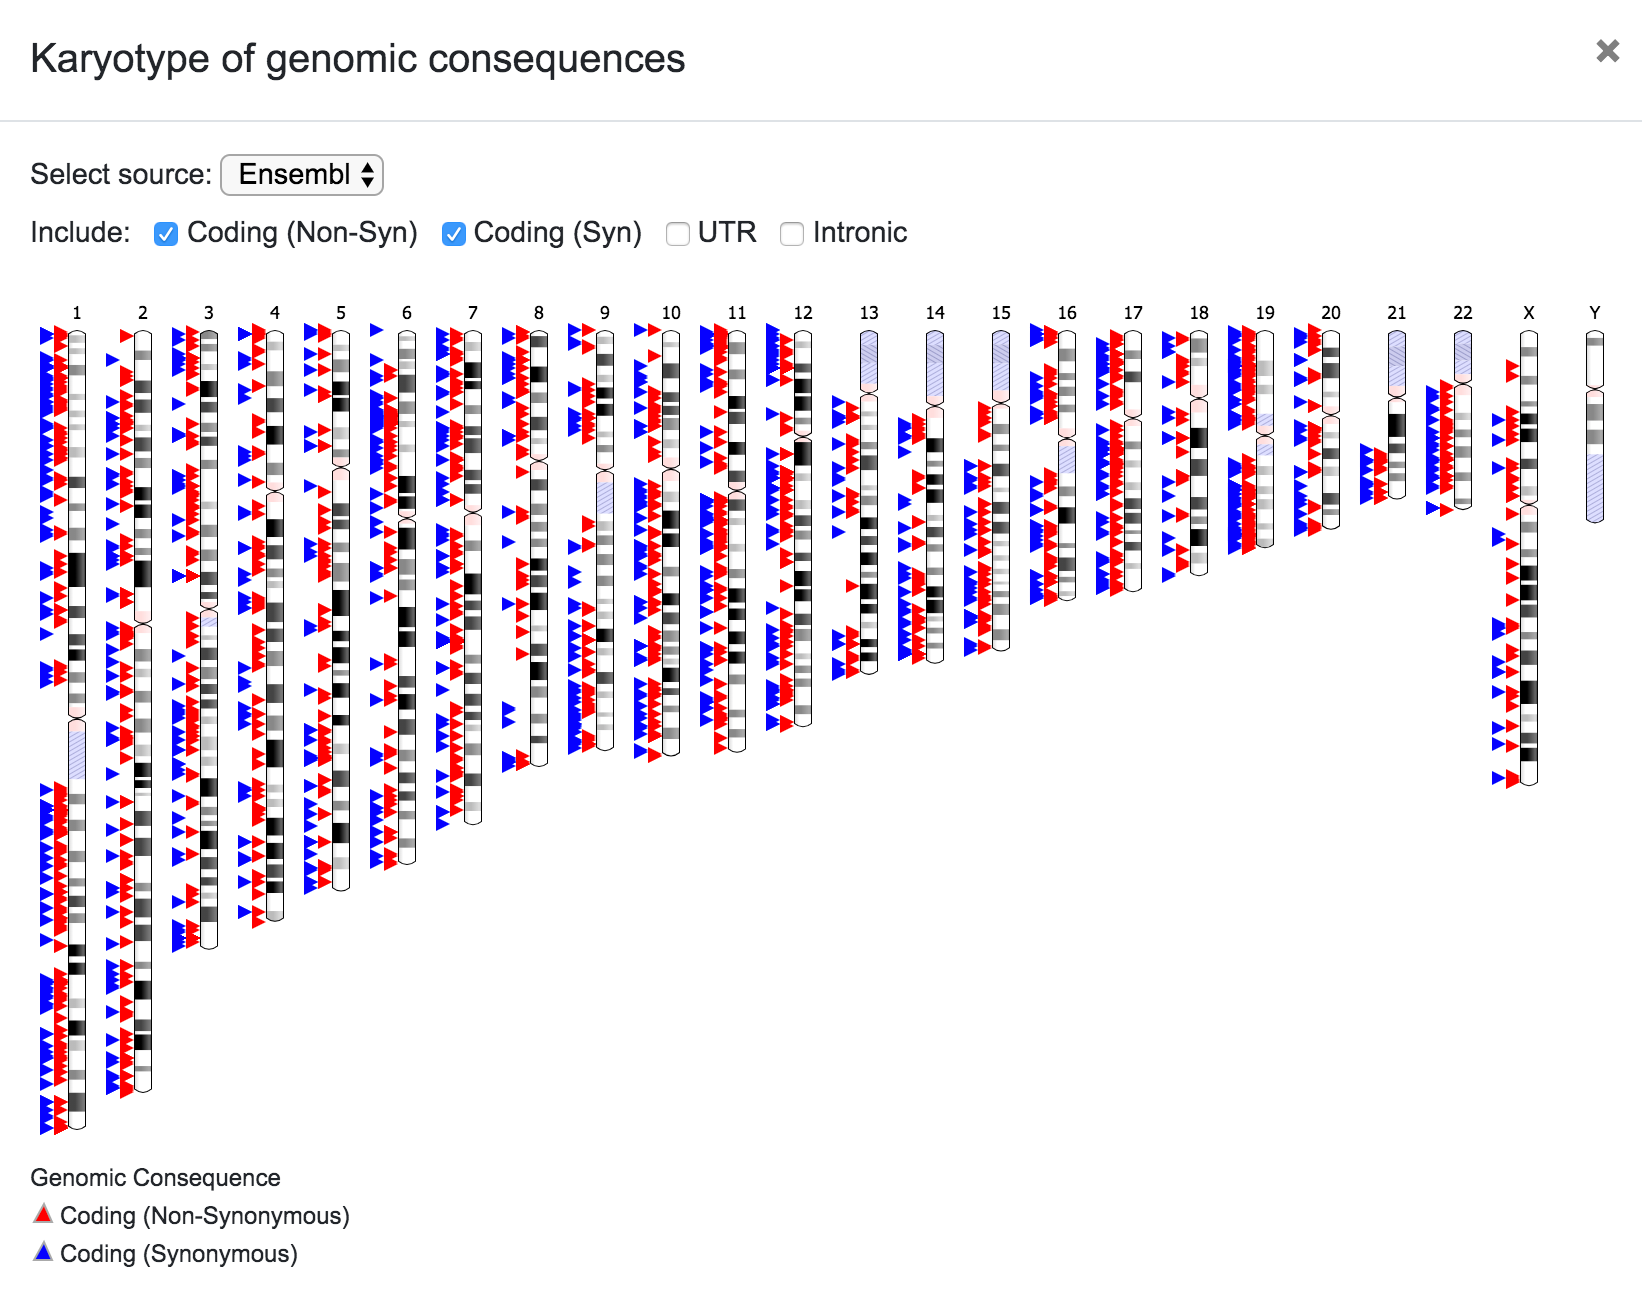
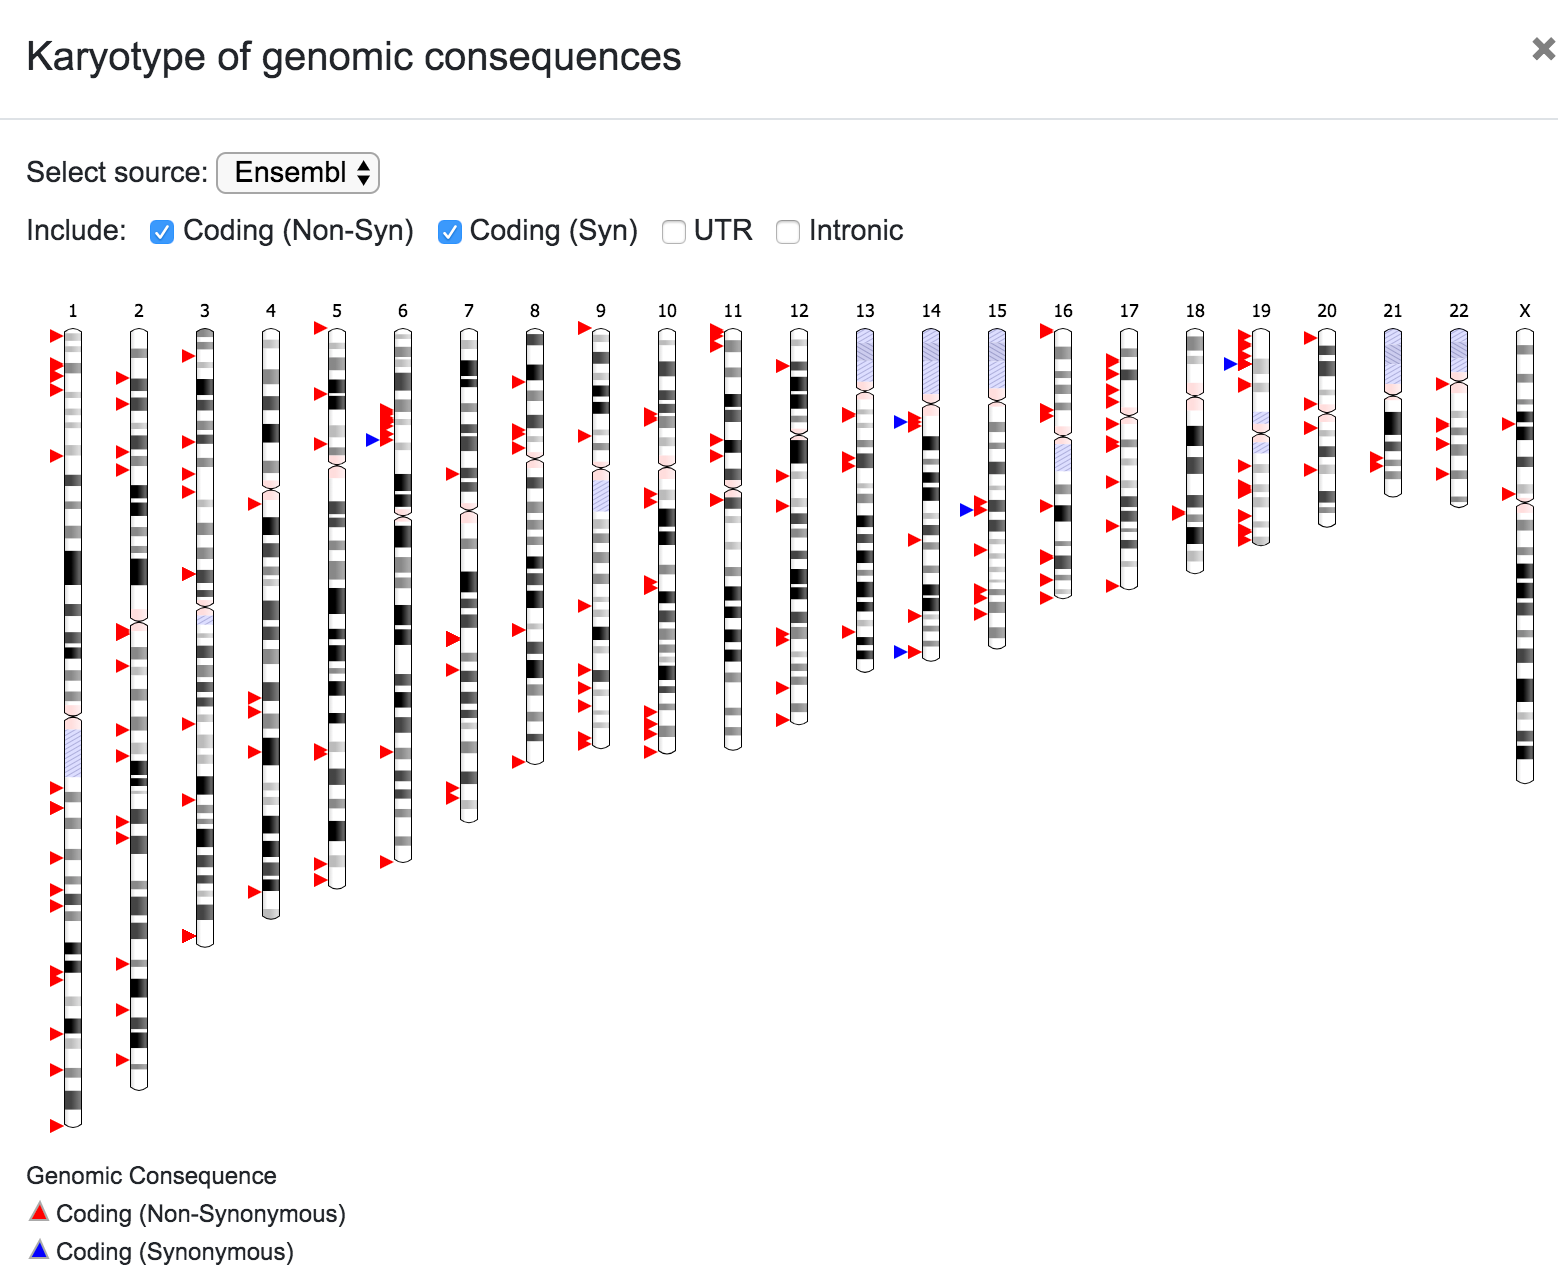
The user can select the source for the karyotype (Ensembl, UCSC, RefSeq, etc), and can also choose to include only a subset of the variants depending on the predicted consequence (Coding Non-Syn, Coding Syn, etc). In the same way, the user can click on any chromosome to get a closer look of the variants' location.
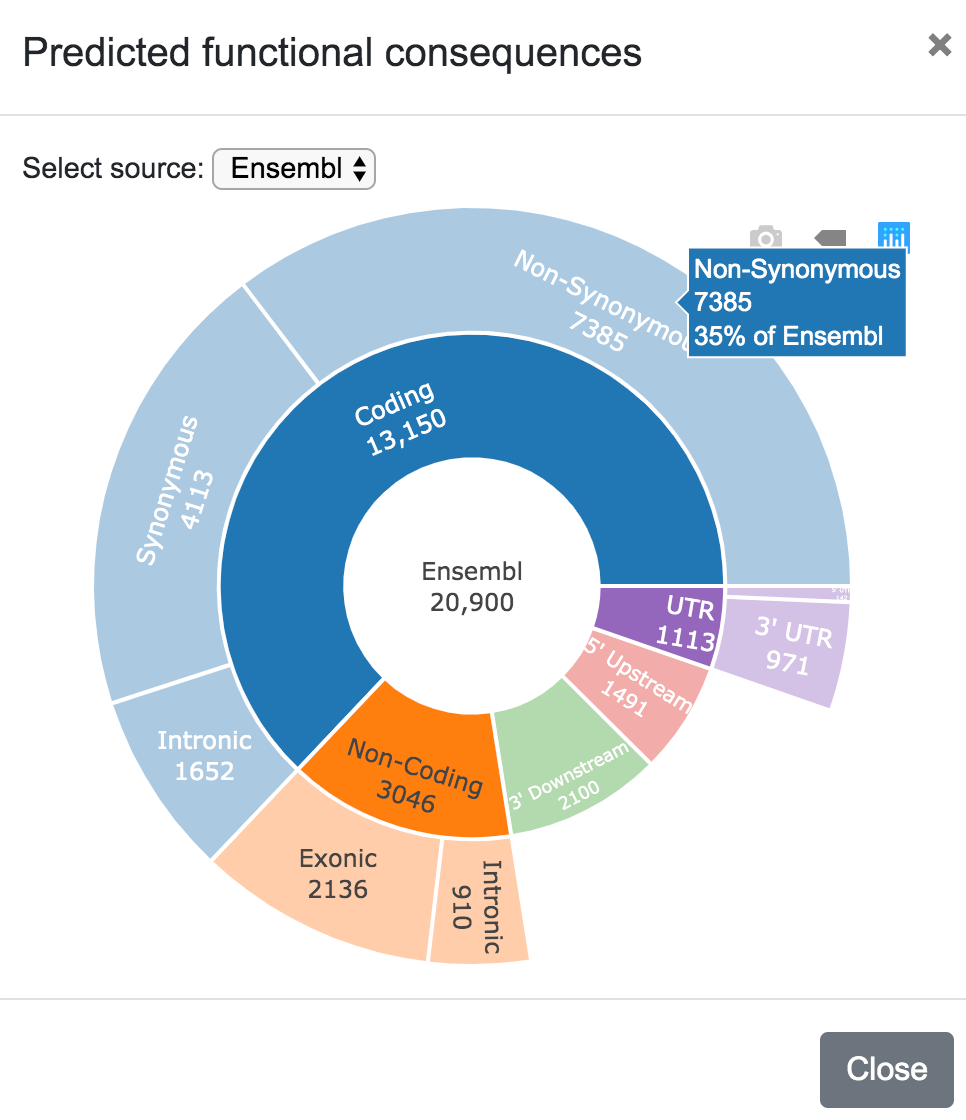
In this plot, the user can also select the data source (Ensembl, UCSC, RefSeq, etc).
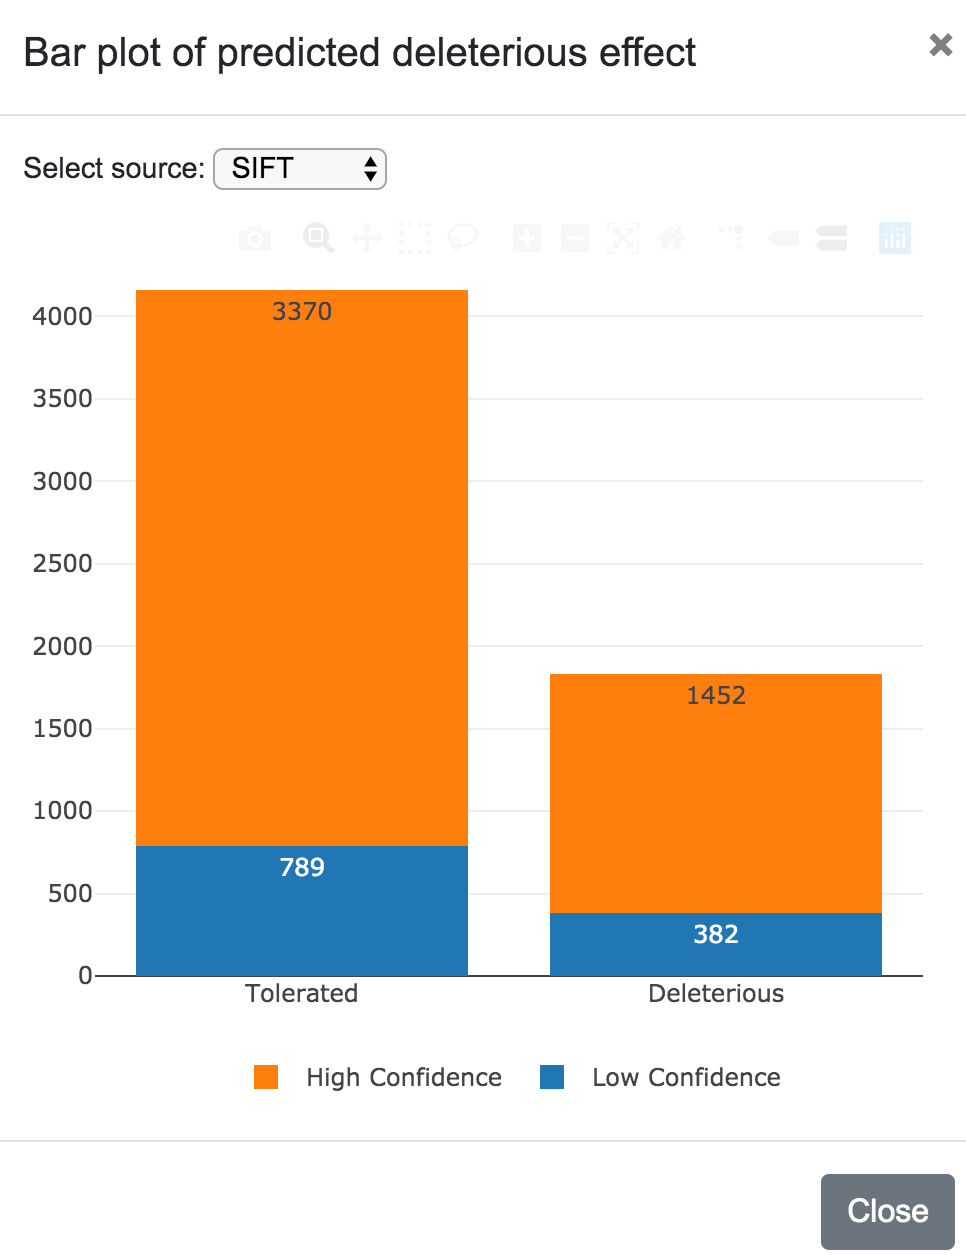
Predicted deleteriousness can be presented as a karyotype plot or as a bar plot. For both, the user can select the source (SIFT or PolyPhen) and in the case of the karyotype, it is also possible to choose to include or exclude the variants per predicted consequence.
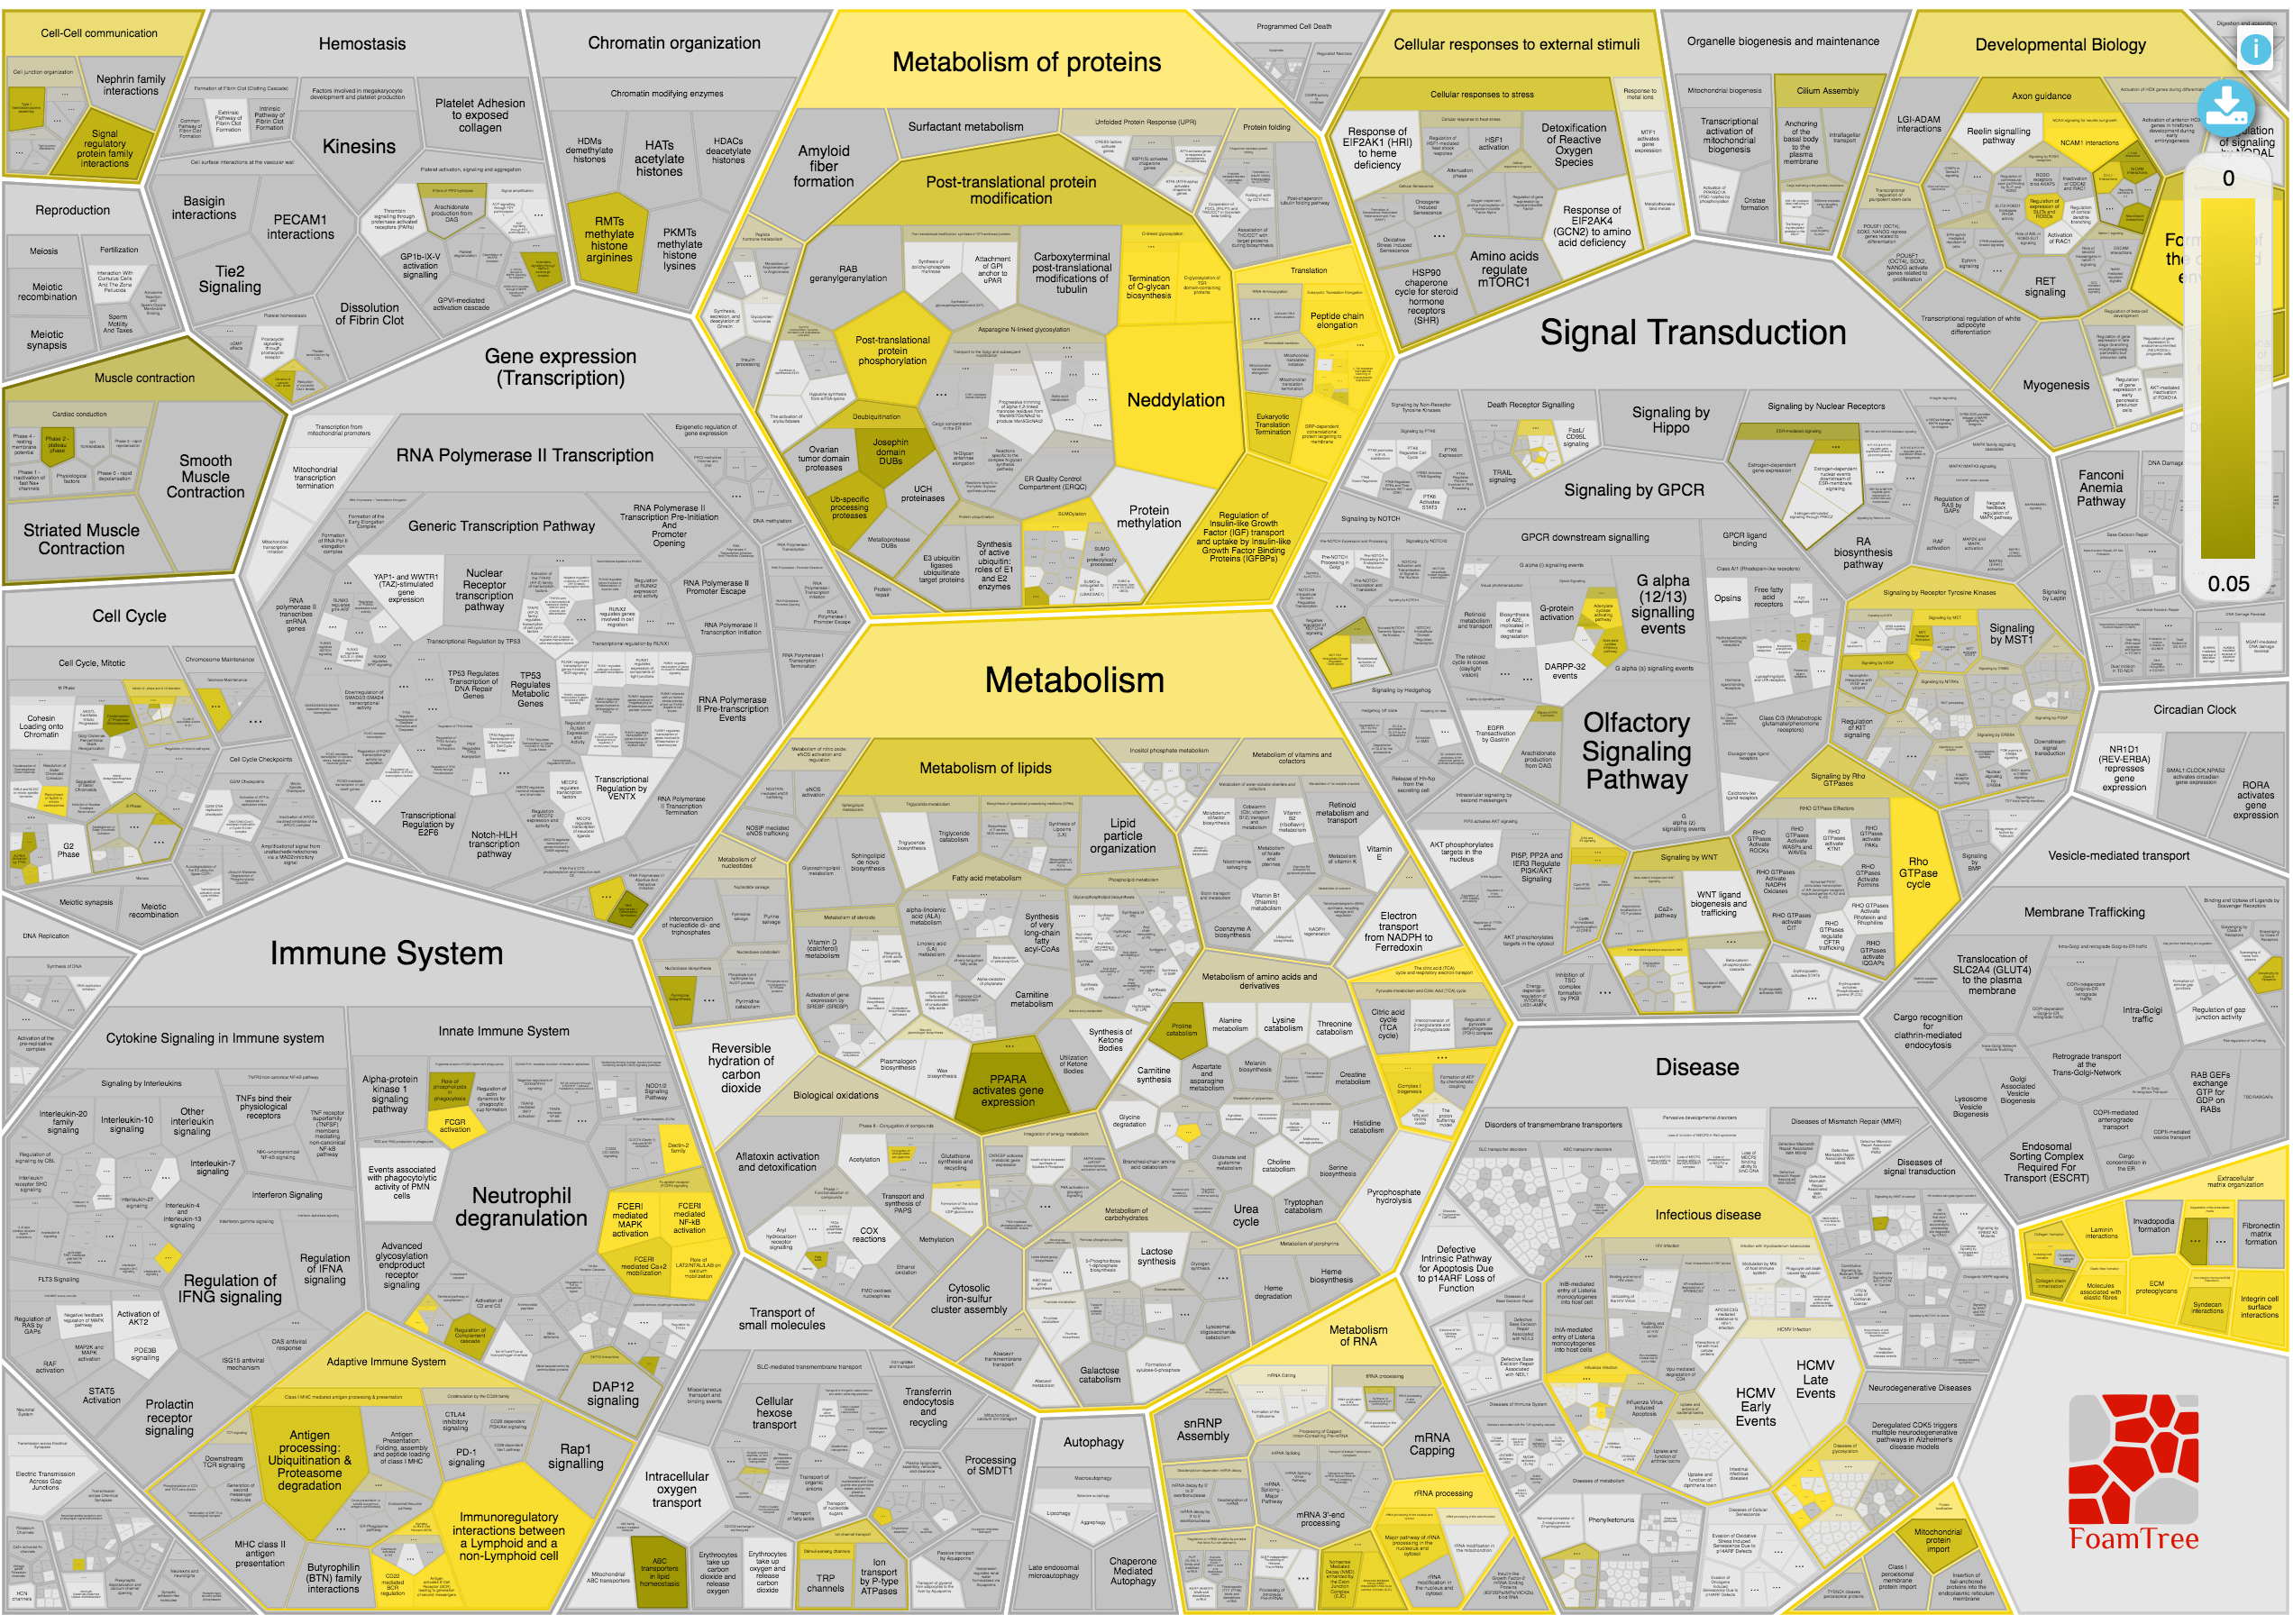
The biological pathways involved in the query are presented in a Voronoi diagram called ReacFoam and developed by the Reactome team. This interactive plot is useful to visualise the hierarchies of the pathways and the p-Values (filtered by lower than 0.05) in the biological processes.
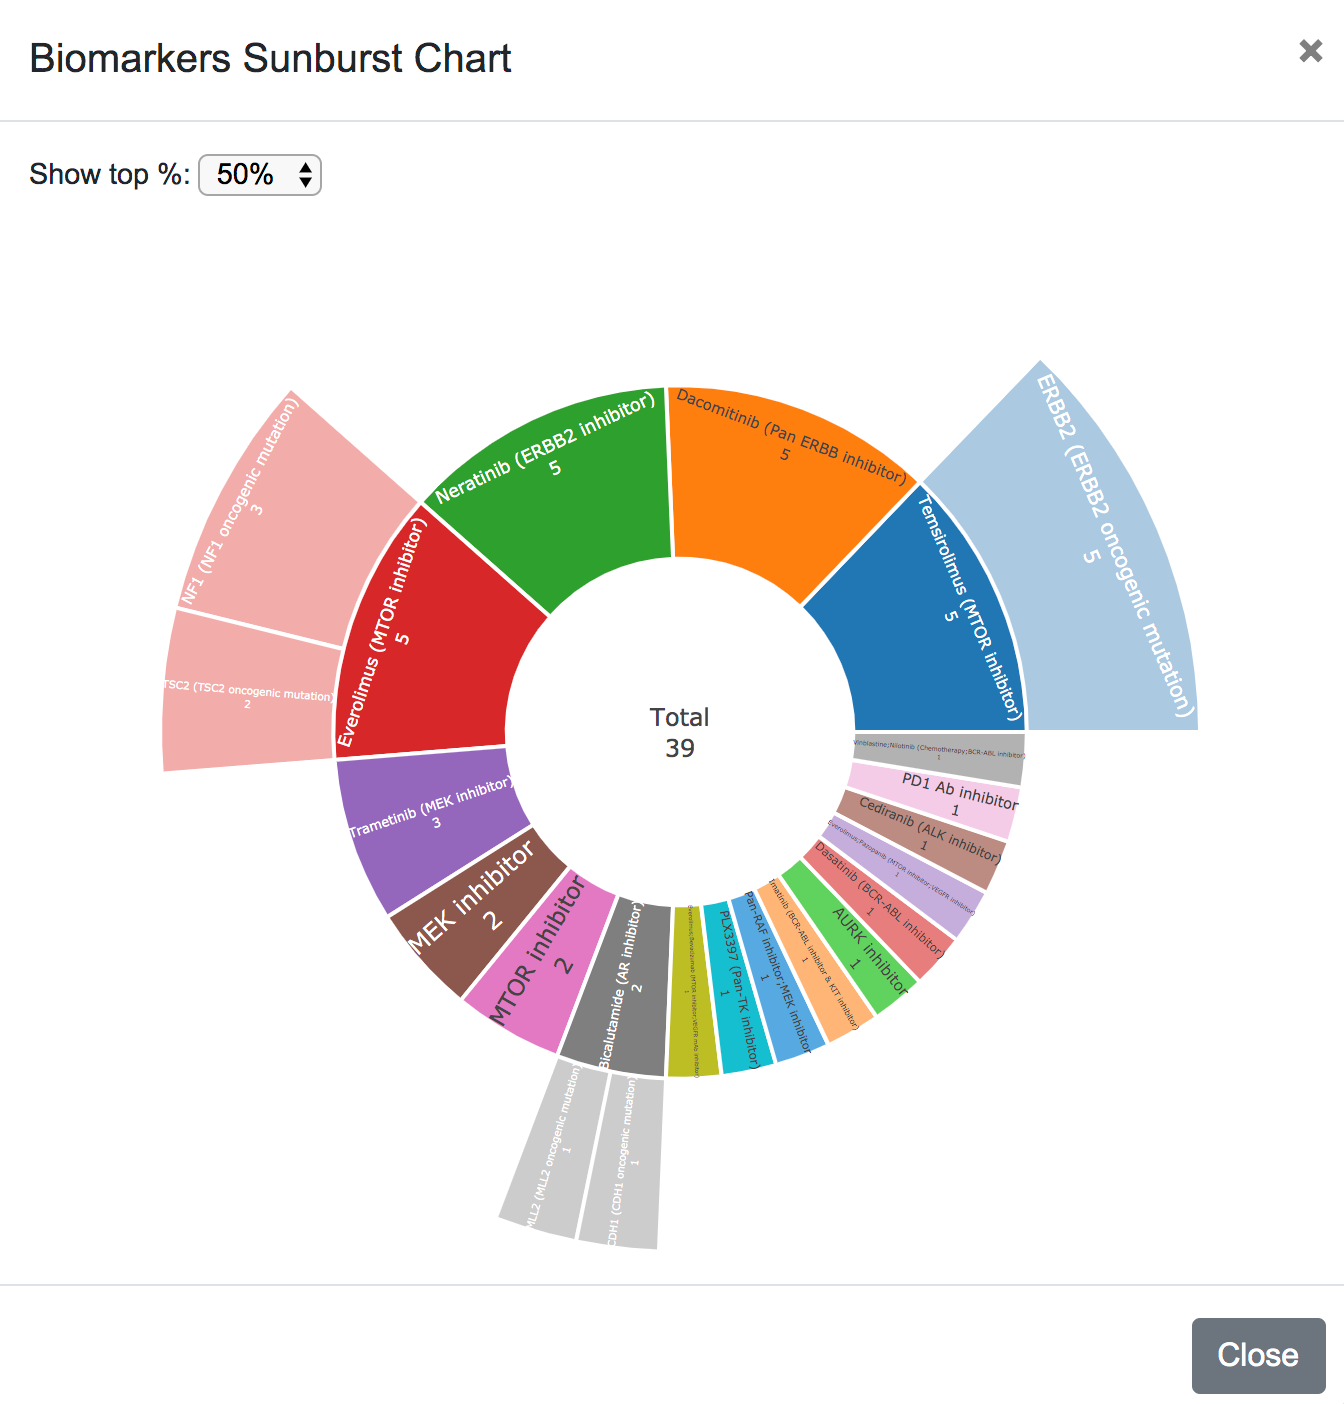
Finaly, the biomarkers are plotted in a sunburst chart, showing the top 20%, 50% or all the drugs and their corresponding biomarkers.
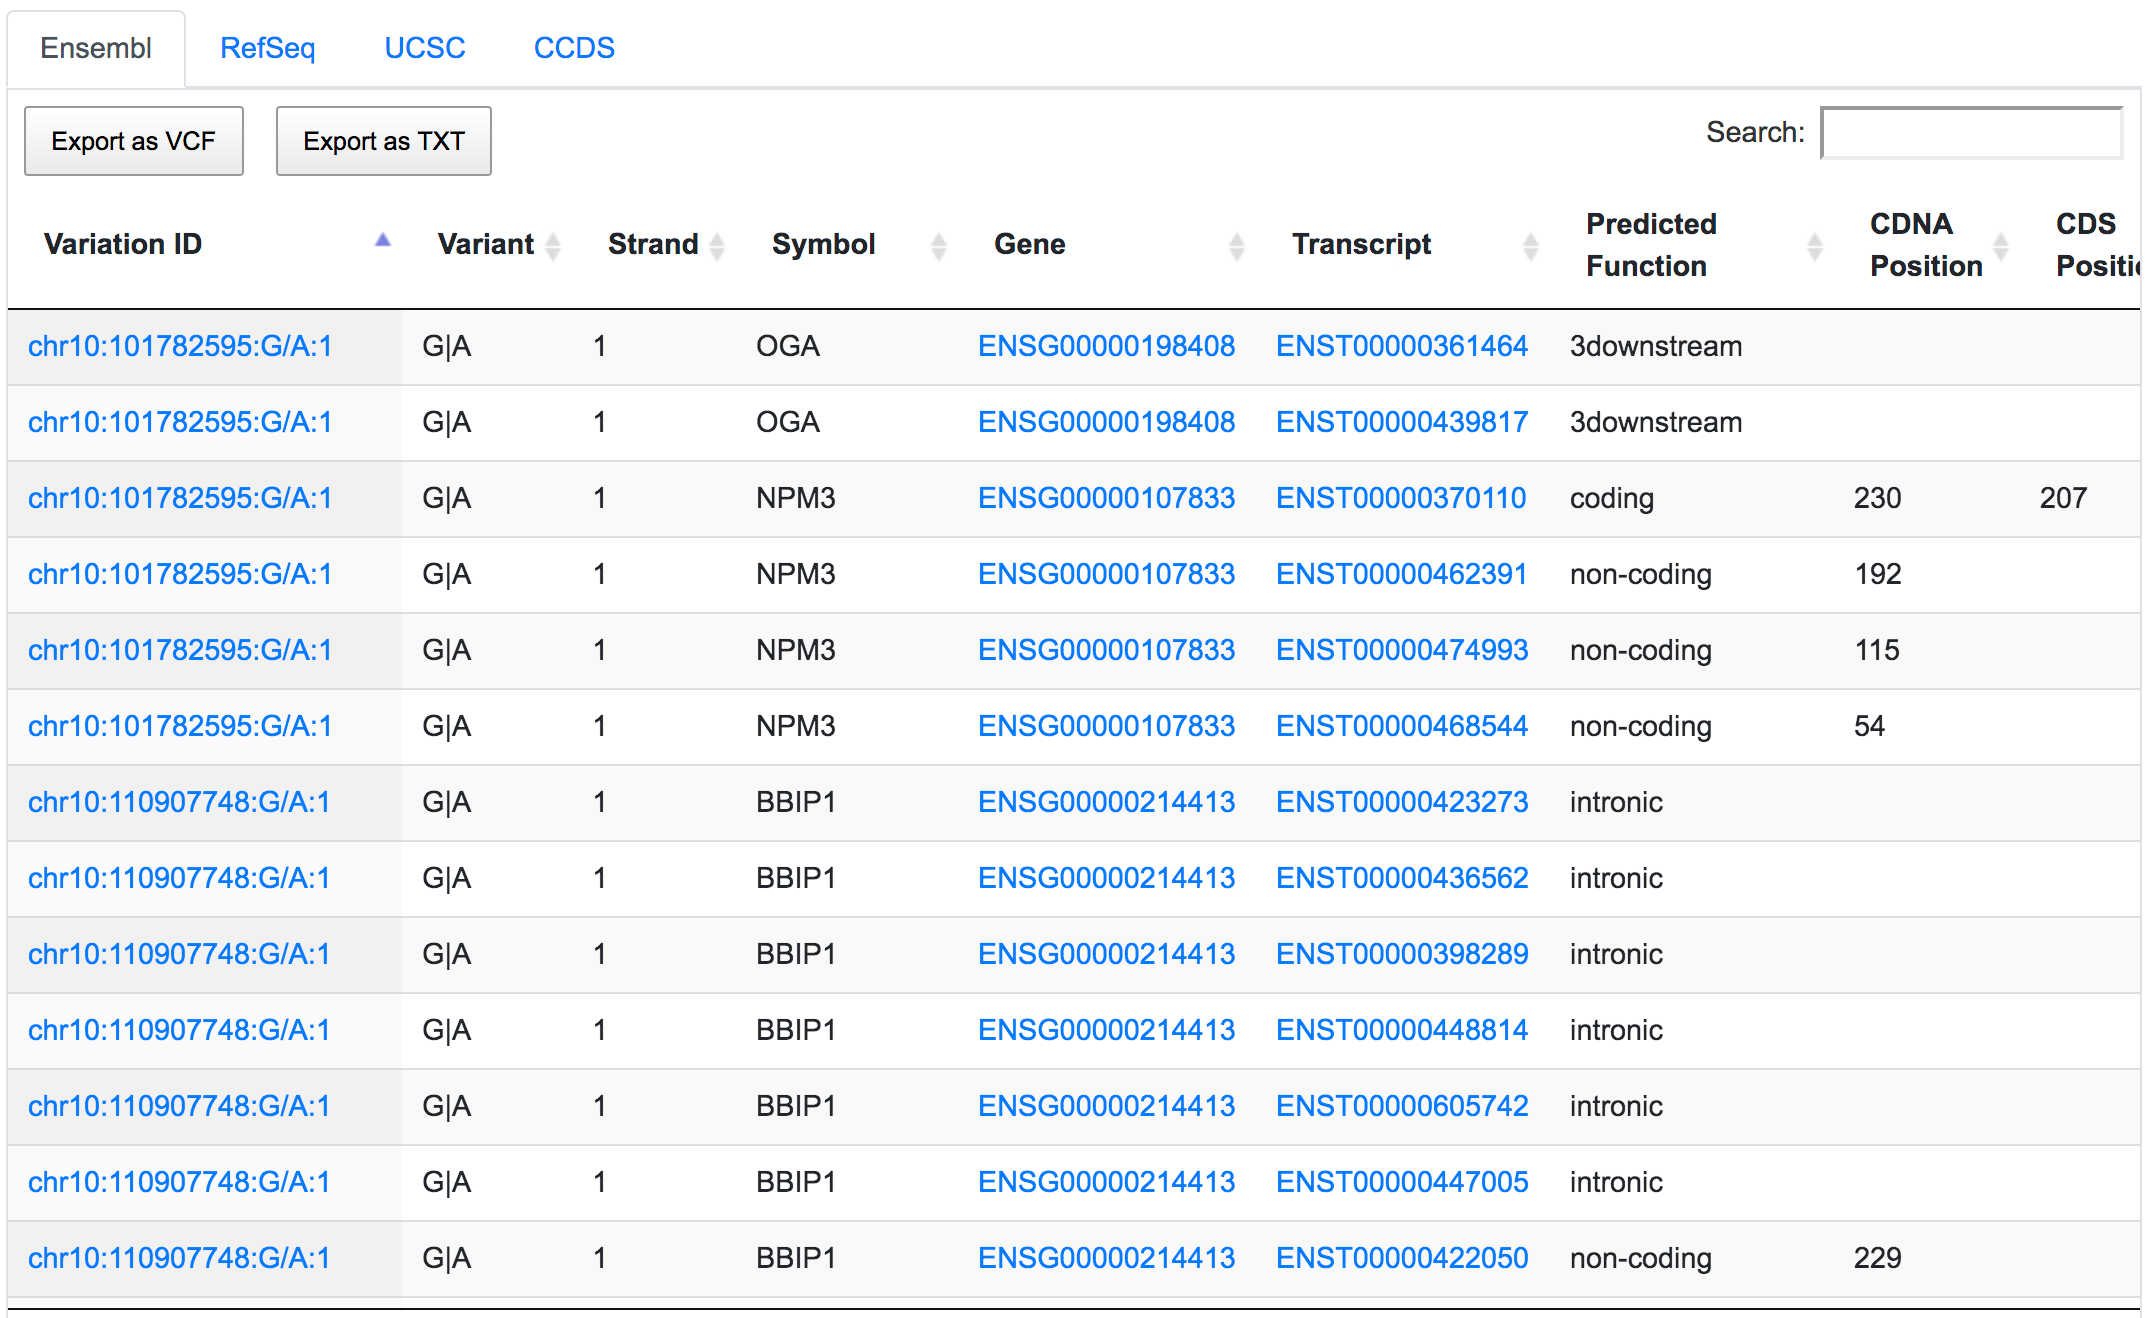
By clicking on the "Show filters" button, SNPnexus will show a series of possible filters for the results. The filtering options may vary according to the original annotation categories selected. In the example below, the system shows results for variants that map to a known dbSNP, with a predicted genomic consequence of Coding Non-Synonymous, and with a predicted effect of Damaging. After applying the filtering. The number of variants after applying the filter is shown in the Query information section.
This is the main results section. It is organised as a series of expandible/collapsible cards, one for each annotation category, and inside each card, each annotation has a tab with the associated results table. By default only the Genomic coordinates card is expanded.
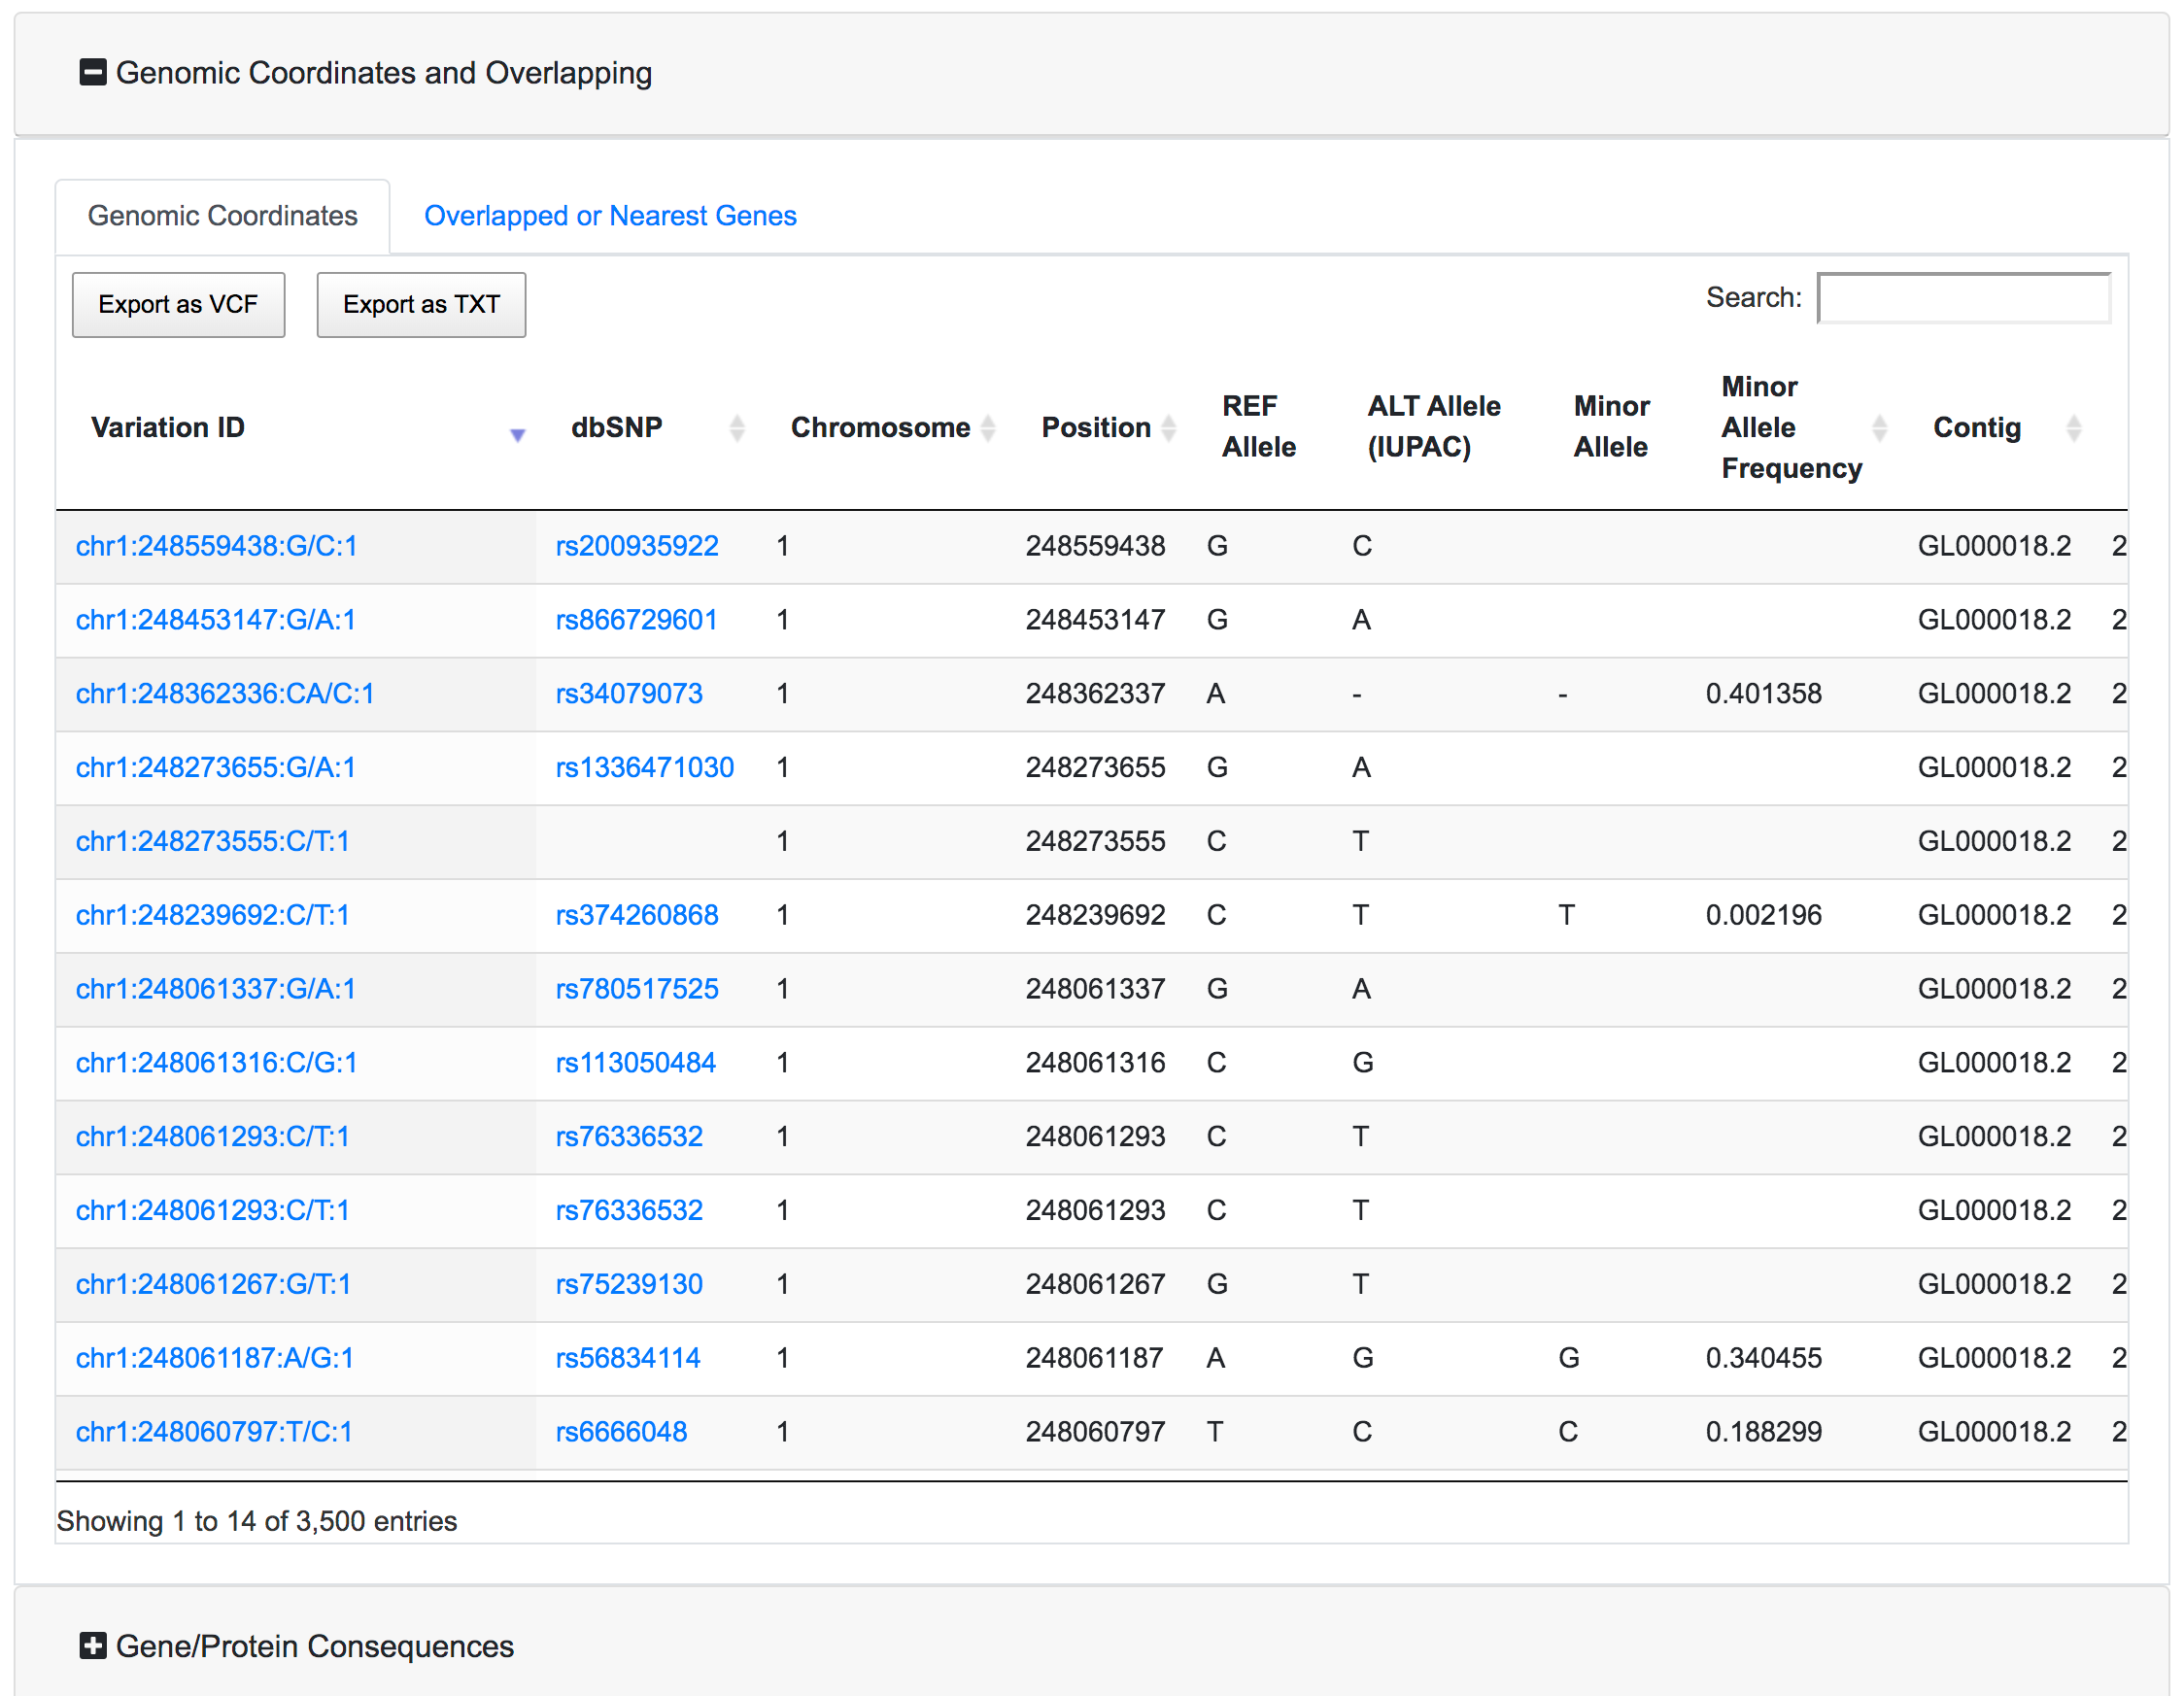
Each table has the option to download the associated data as VCF or Tab-separated file. There is also a search box where the user can query the specific table for a specific variant. The export buttons of the tables will allow to export the results reflecting the applied filters and the search query.
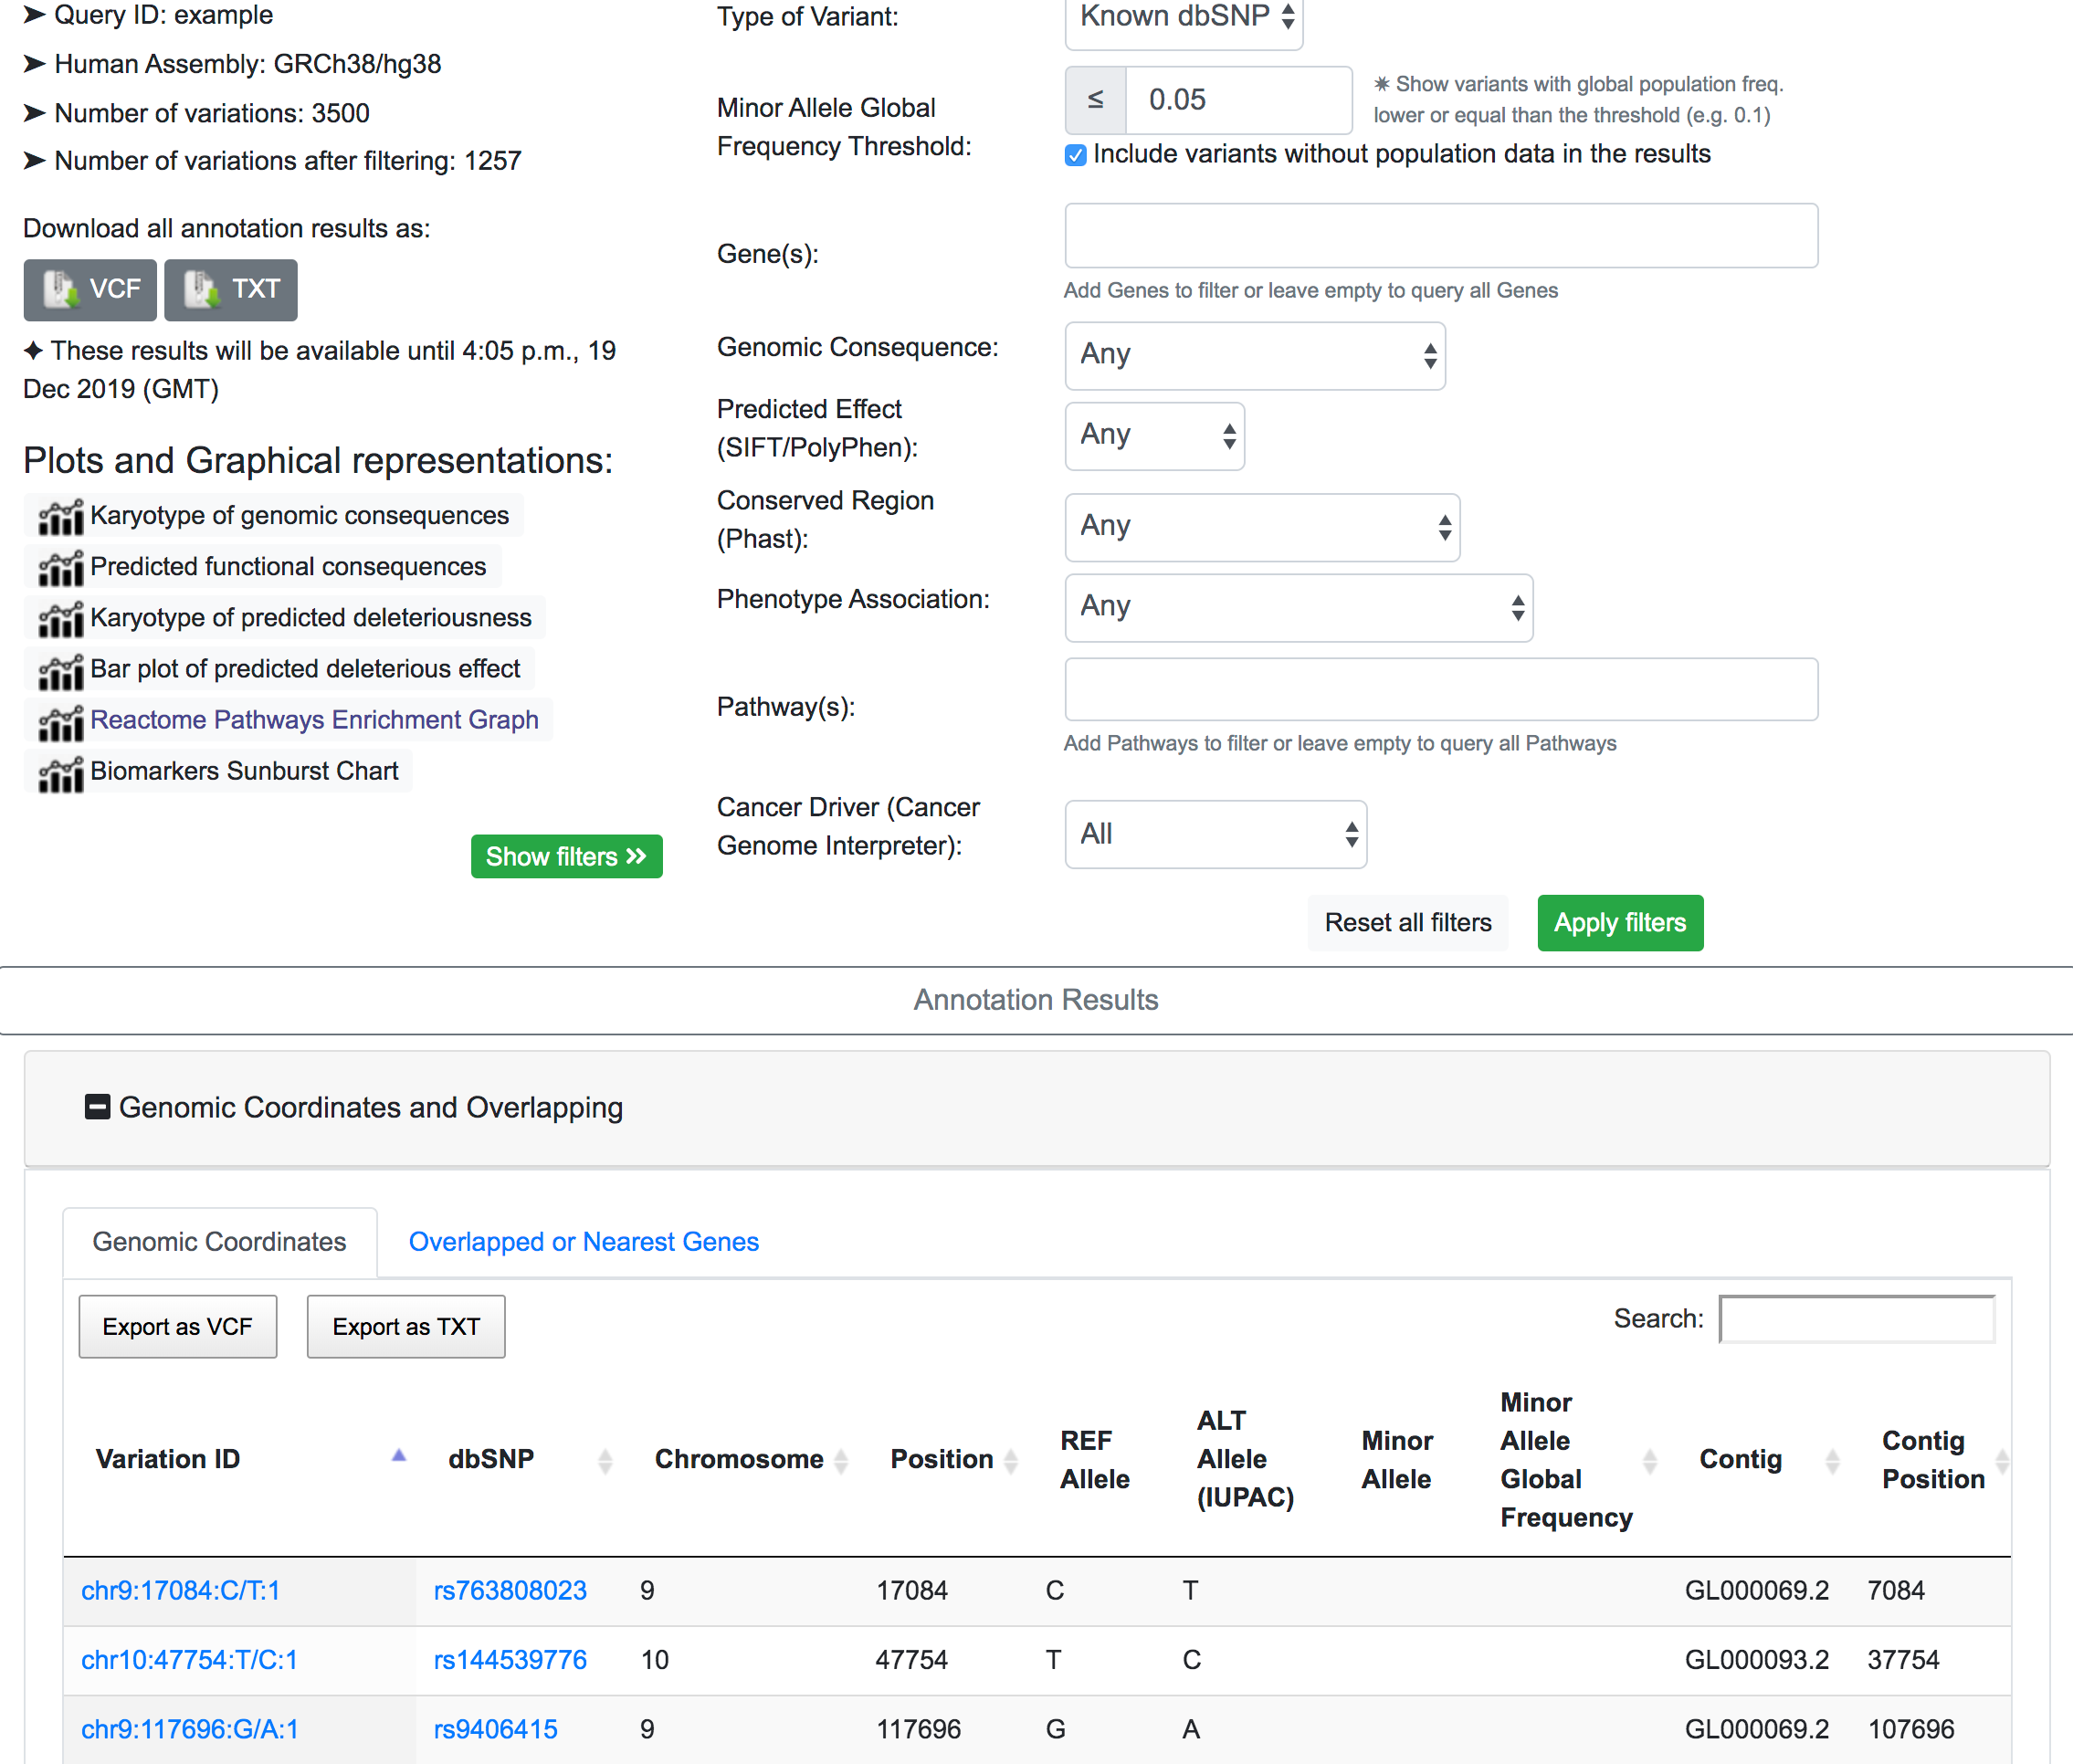
Analysing variants' effects on genes and proteins
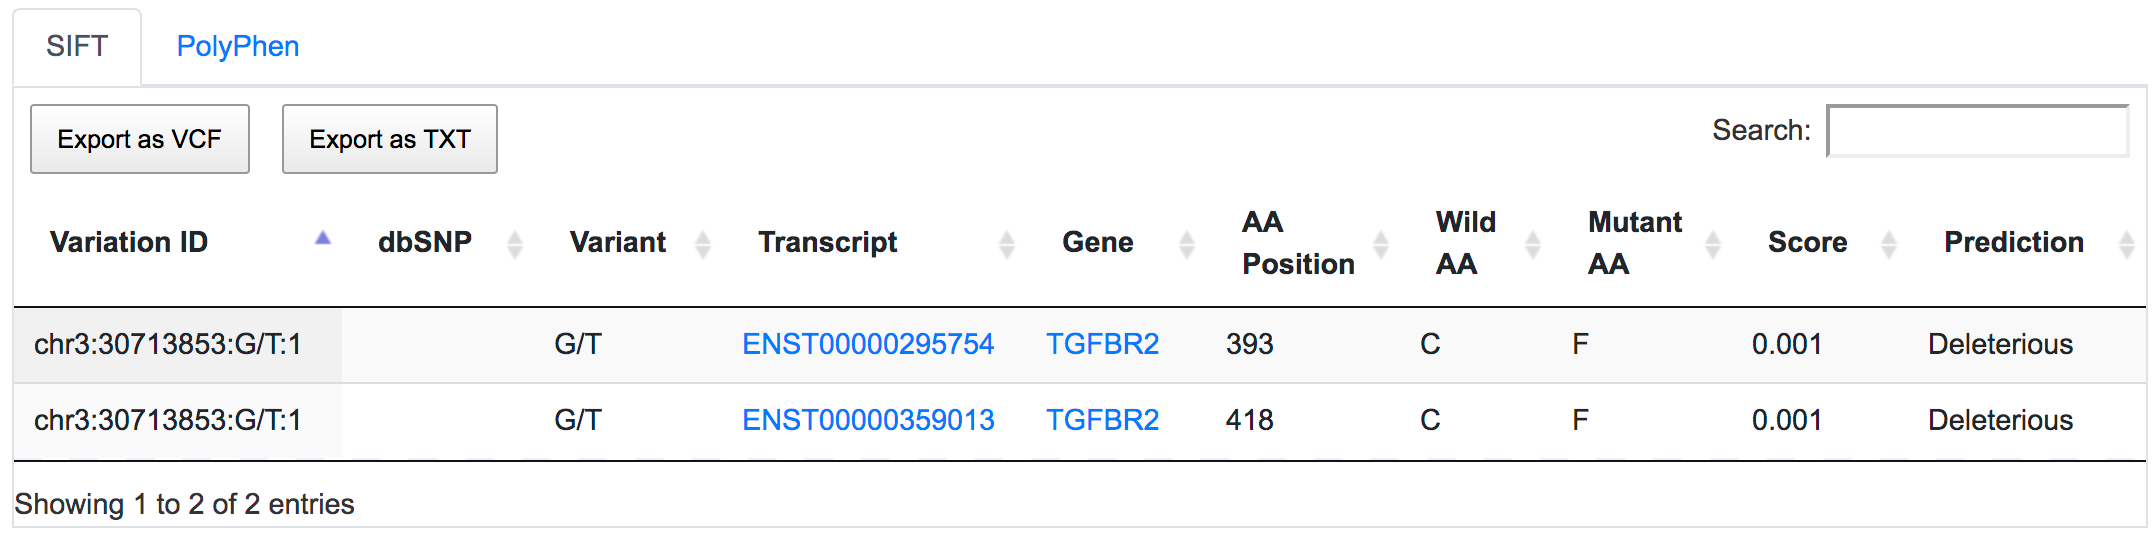
SNPnexus considers different gene annotation systems to assess the functional consequences on the possible isoforms. In the following example, the variant chr3:30713853:G/T was implicated in pancreatic tumourigenesis by altering genes involved in the TGF-β signalling pathway. Using SNPnexus, we assessed in detail the functional consequences of this variant on RefSeq, Ensembl, AceView and Vega. All of the four annotation systems agree upon the coding non-synonymous effect (C393F, C418F) of the variant on two alternative transcripts of the transforming growth factor beta receptor II (TGFBR2) gene. But SNPnexus also identifies possible downstream effects on two AceView transcripts as well.
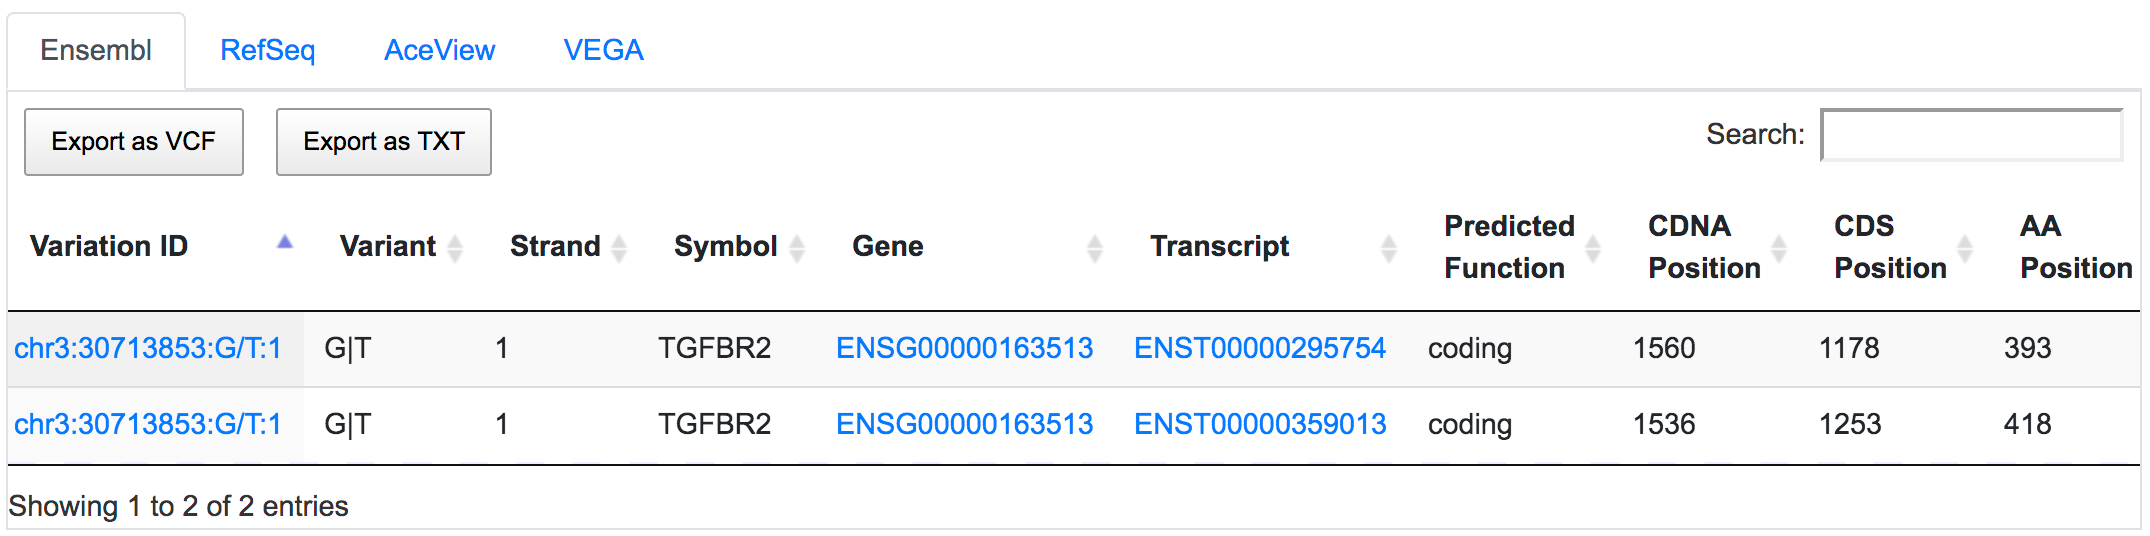
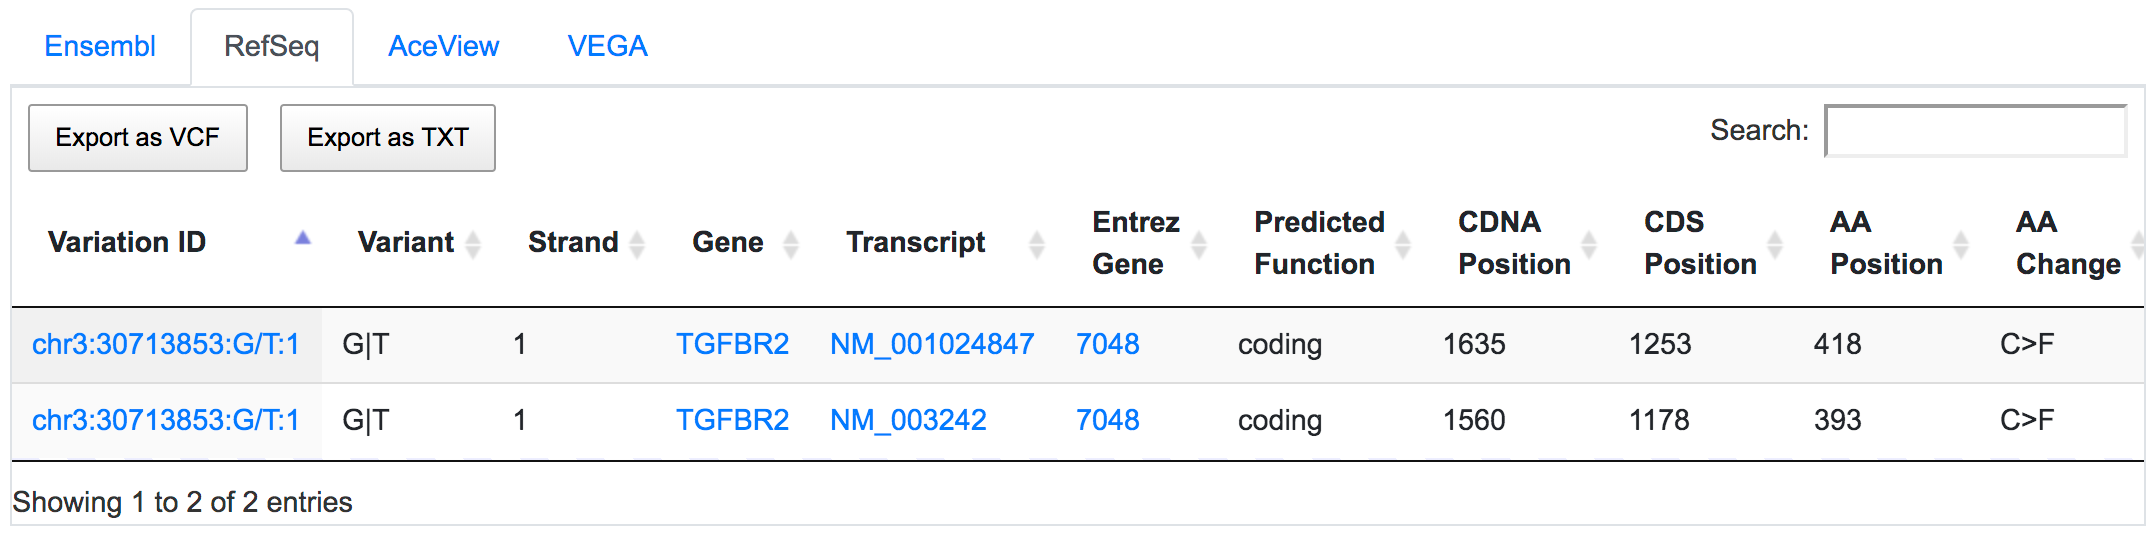
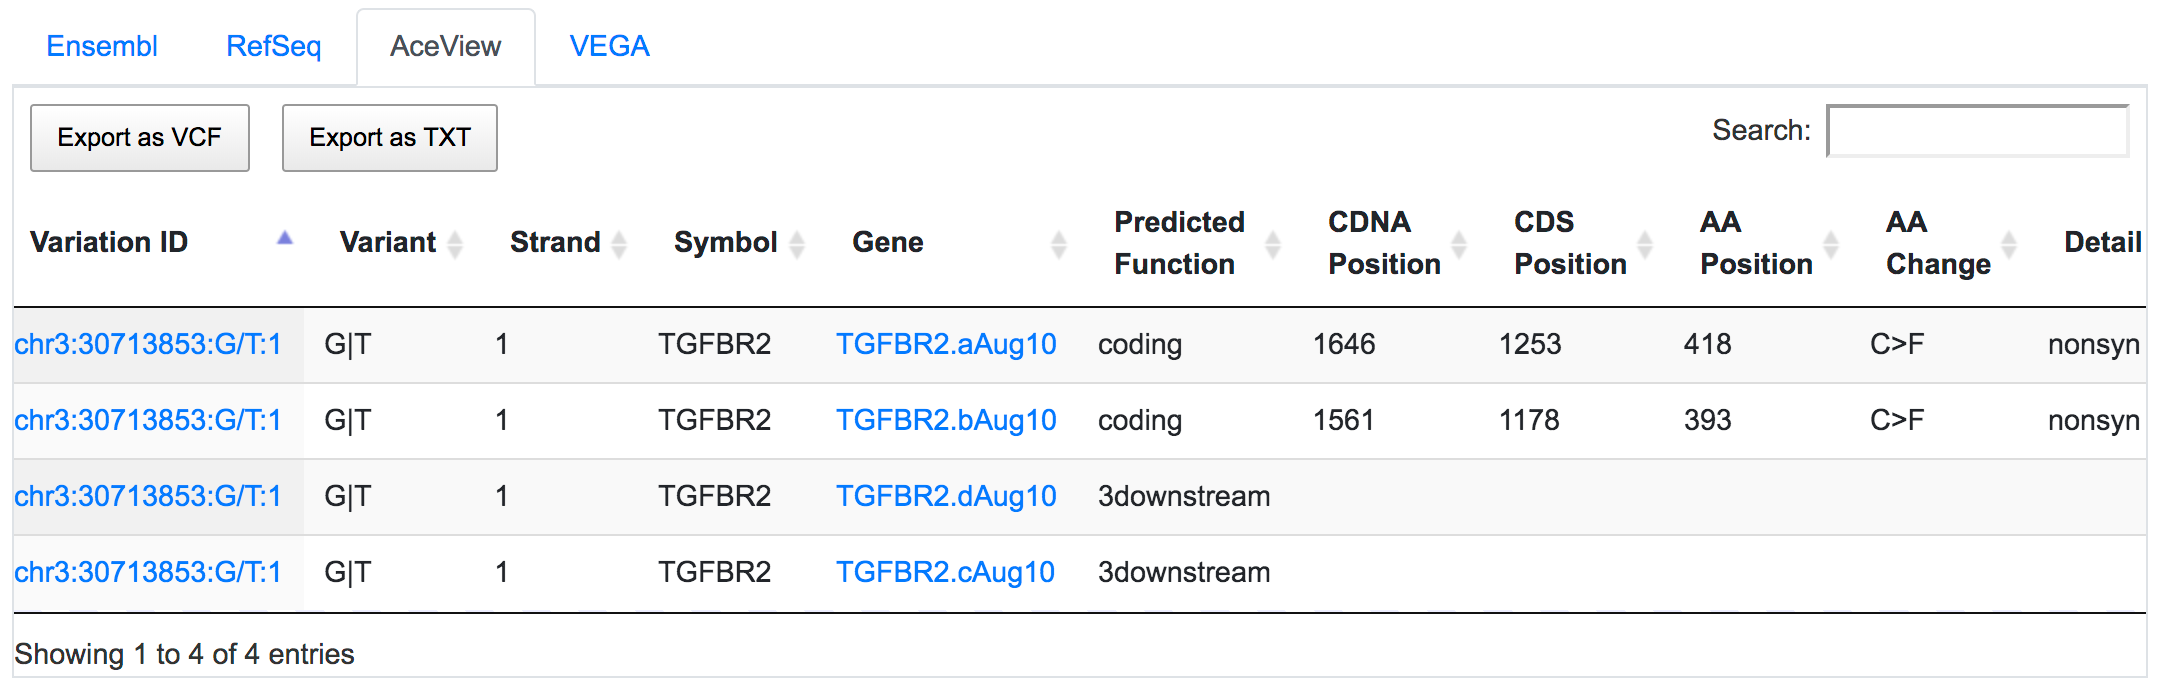
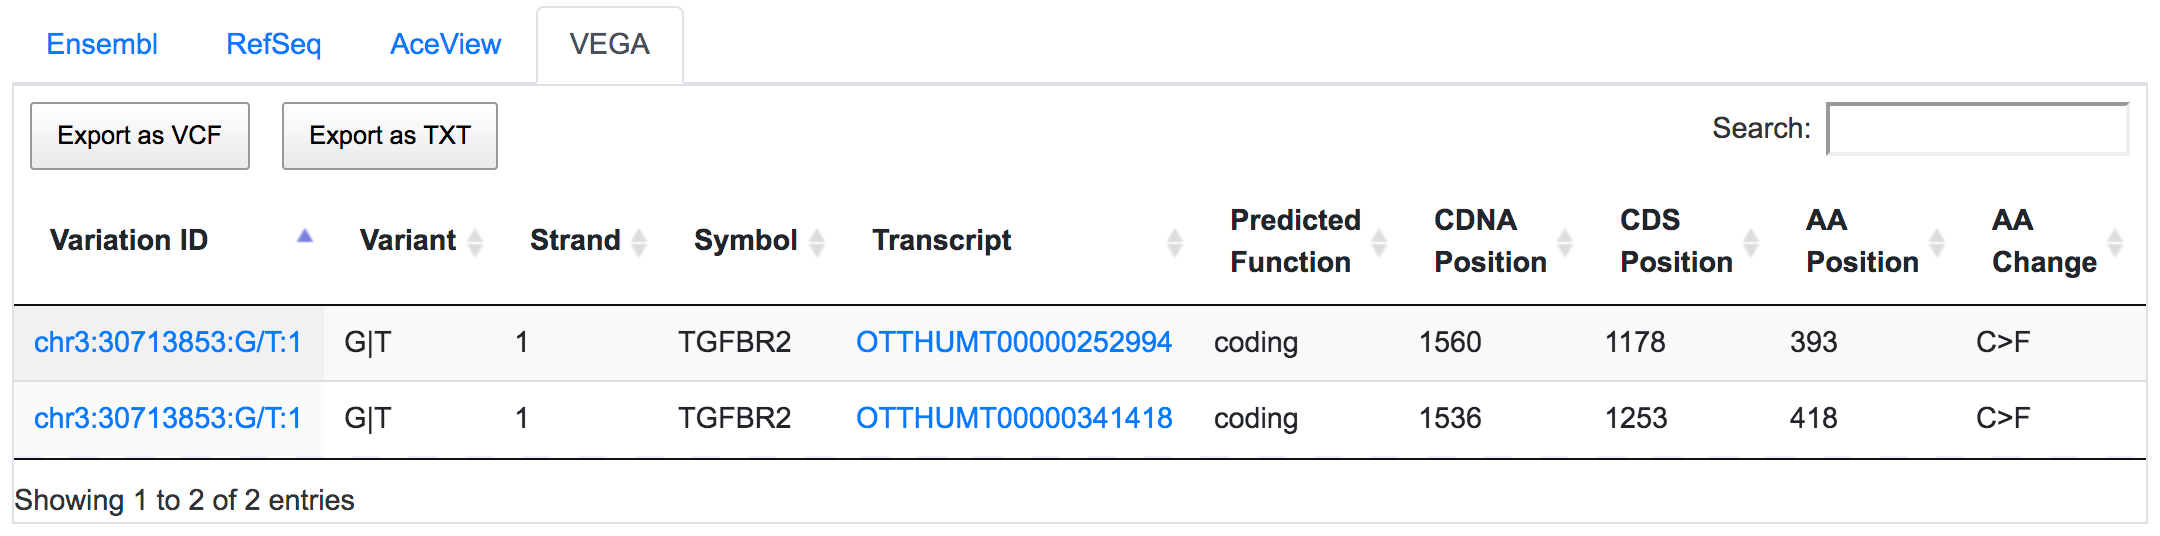
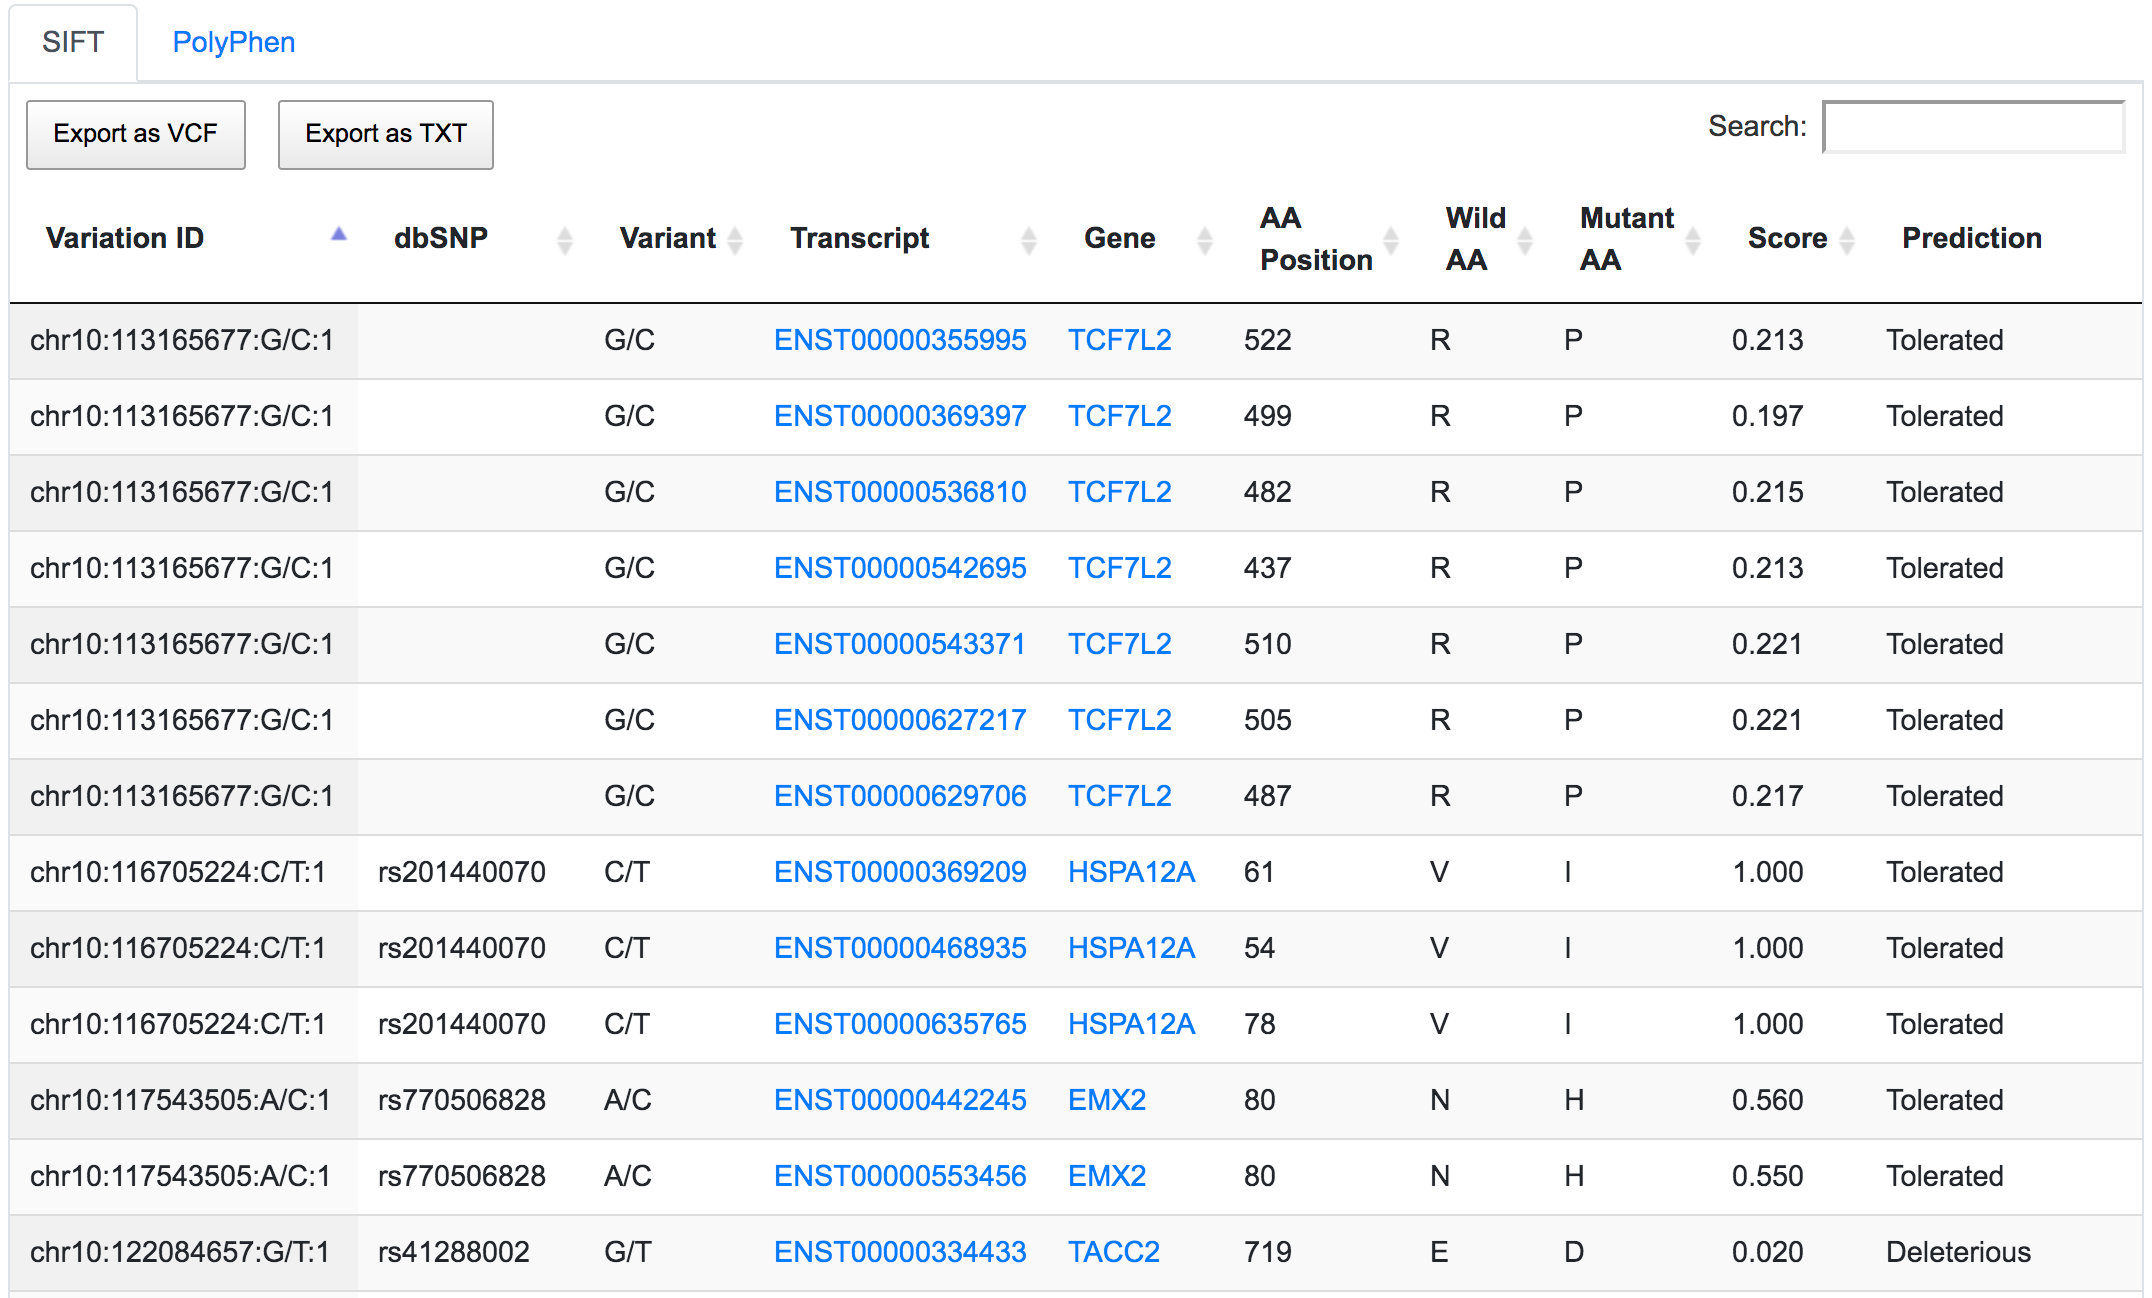
The corresponding protein alterations are predicted as deleterious by SIFT.
The dbSNP rs3218998 has 5'-UTR and upstream effect on 8-oxoguanine DNA glycosylase (OGG1) gene, but it could have a downstream effect on the neighbouring bromodomain and PHD finger containing protein 1 (BRPF1). Interestingly, a potential peptide shift is detected on one AceView isoform, which is not captured by RefSeq or Ensembl.
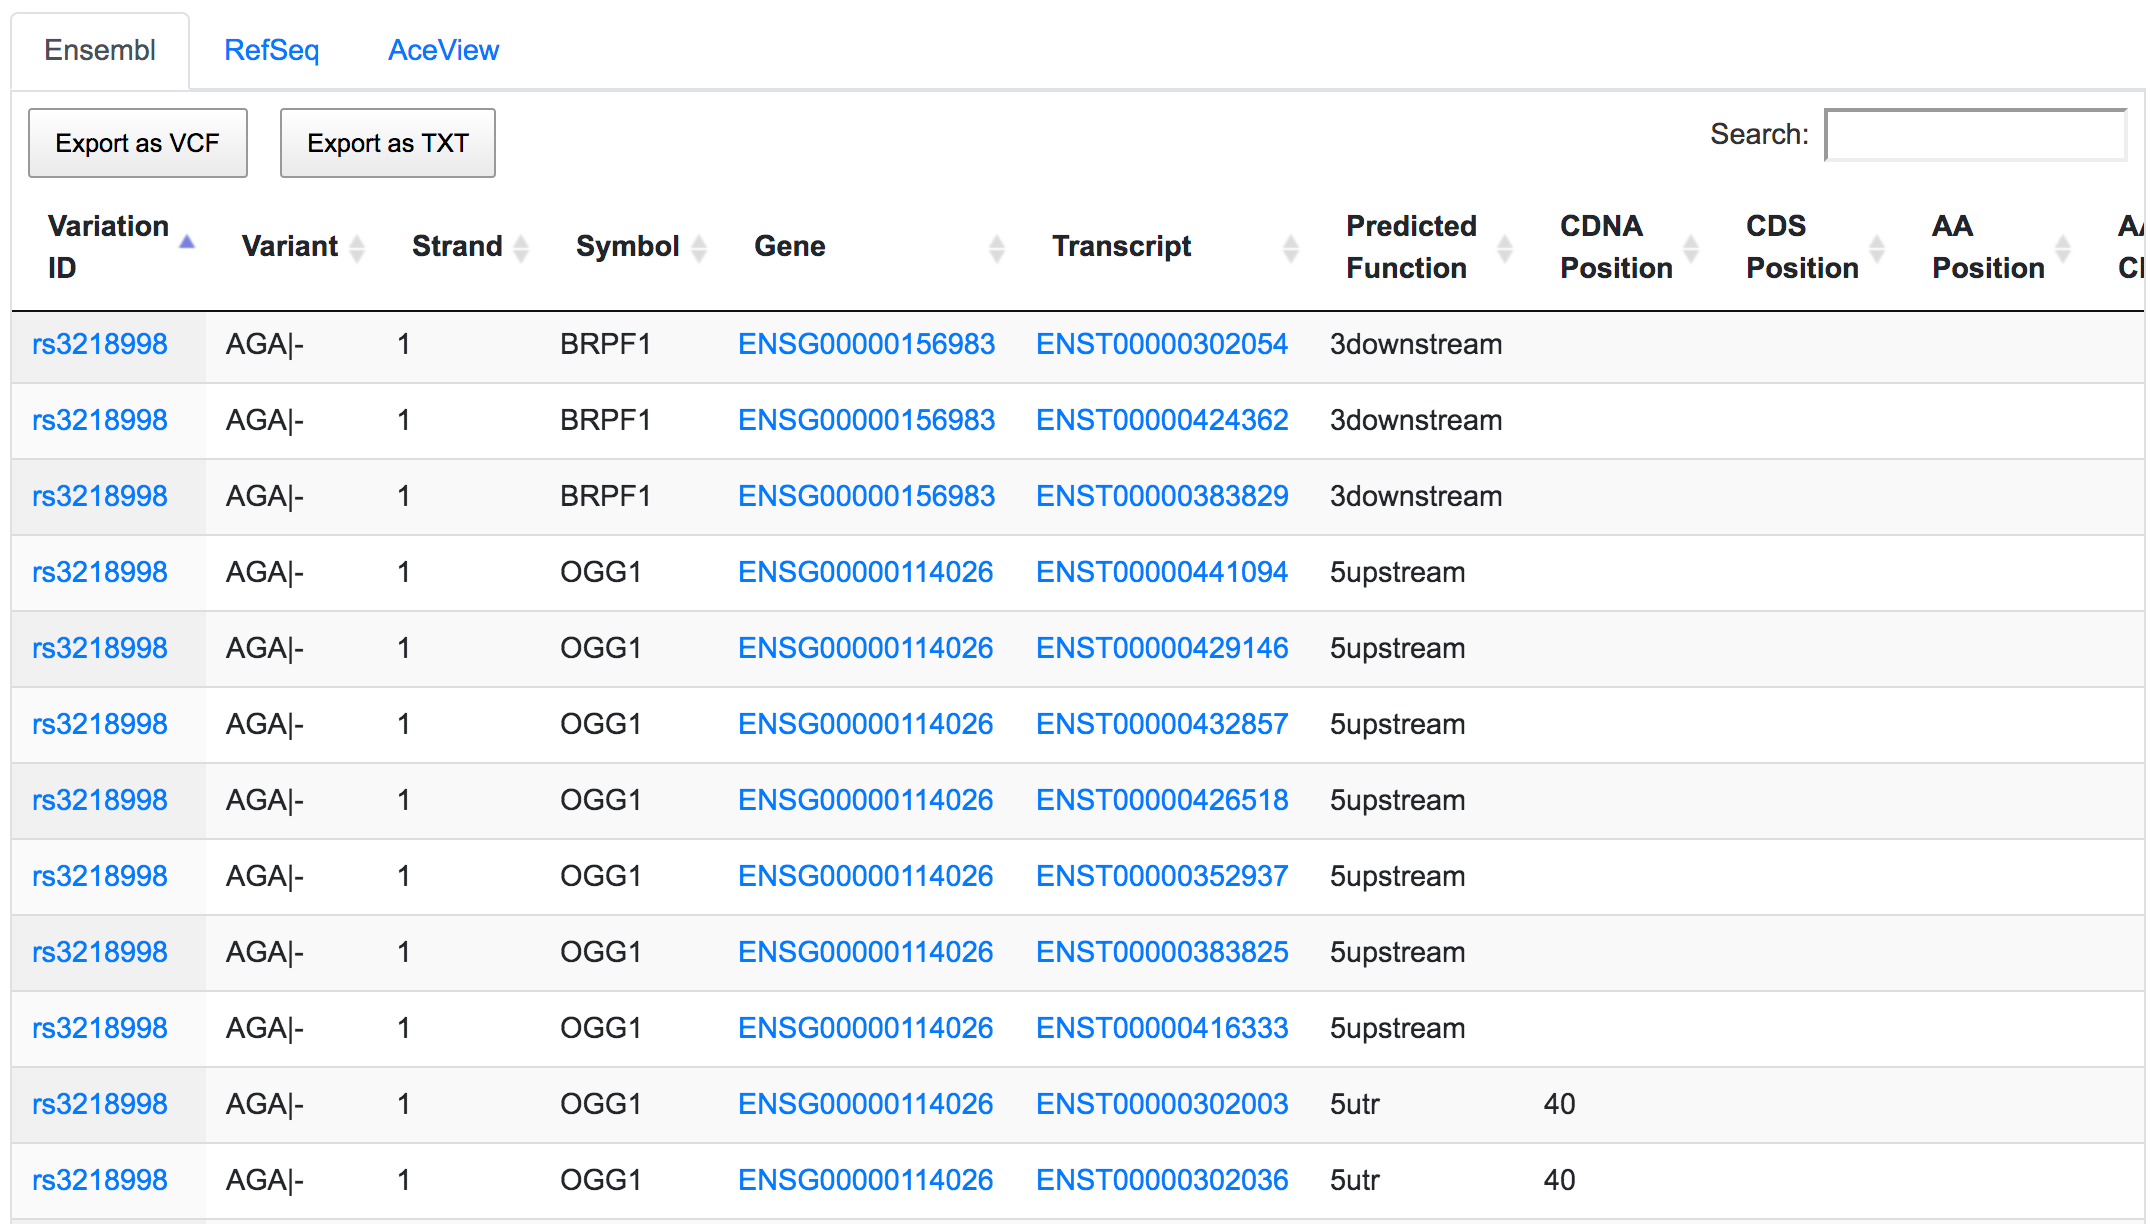
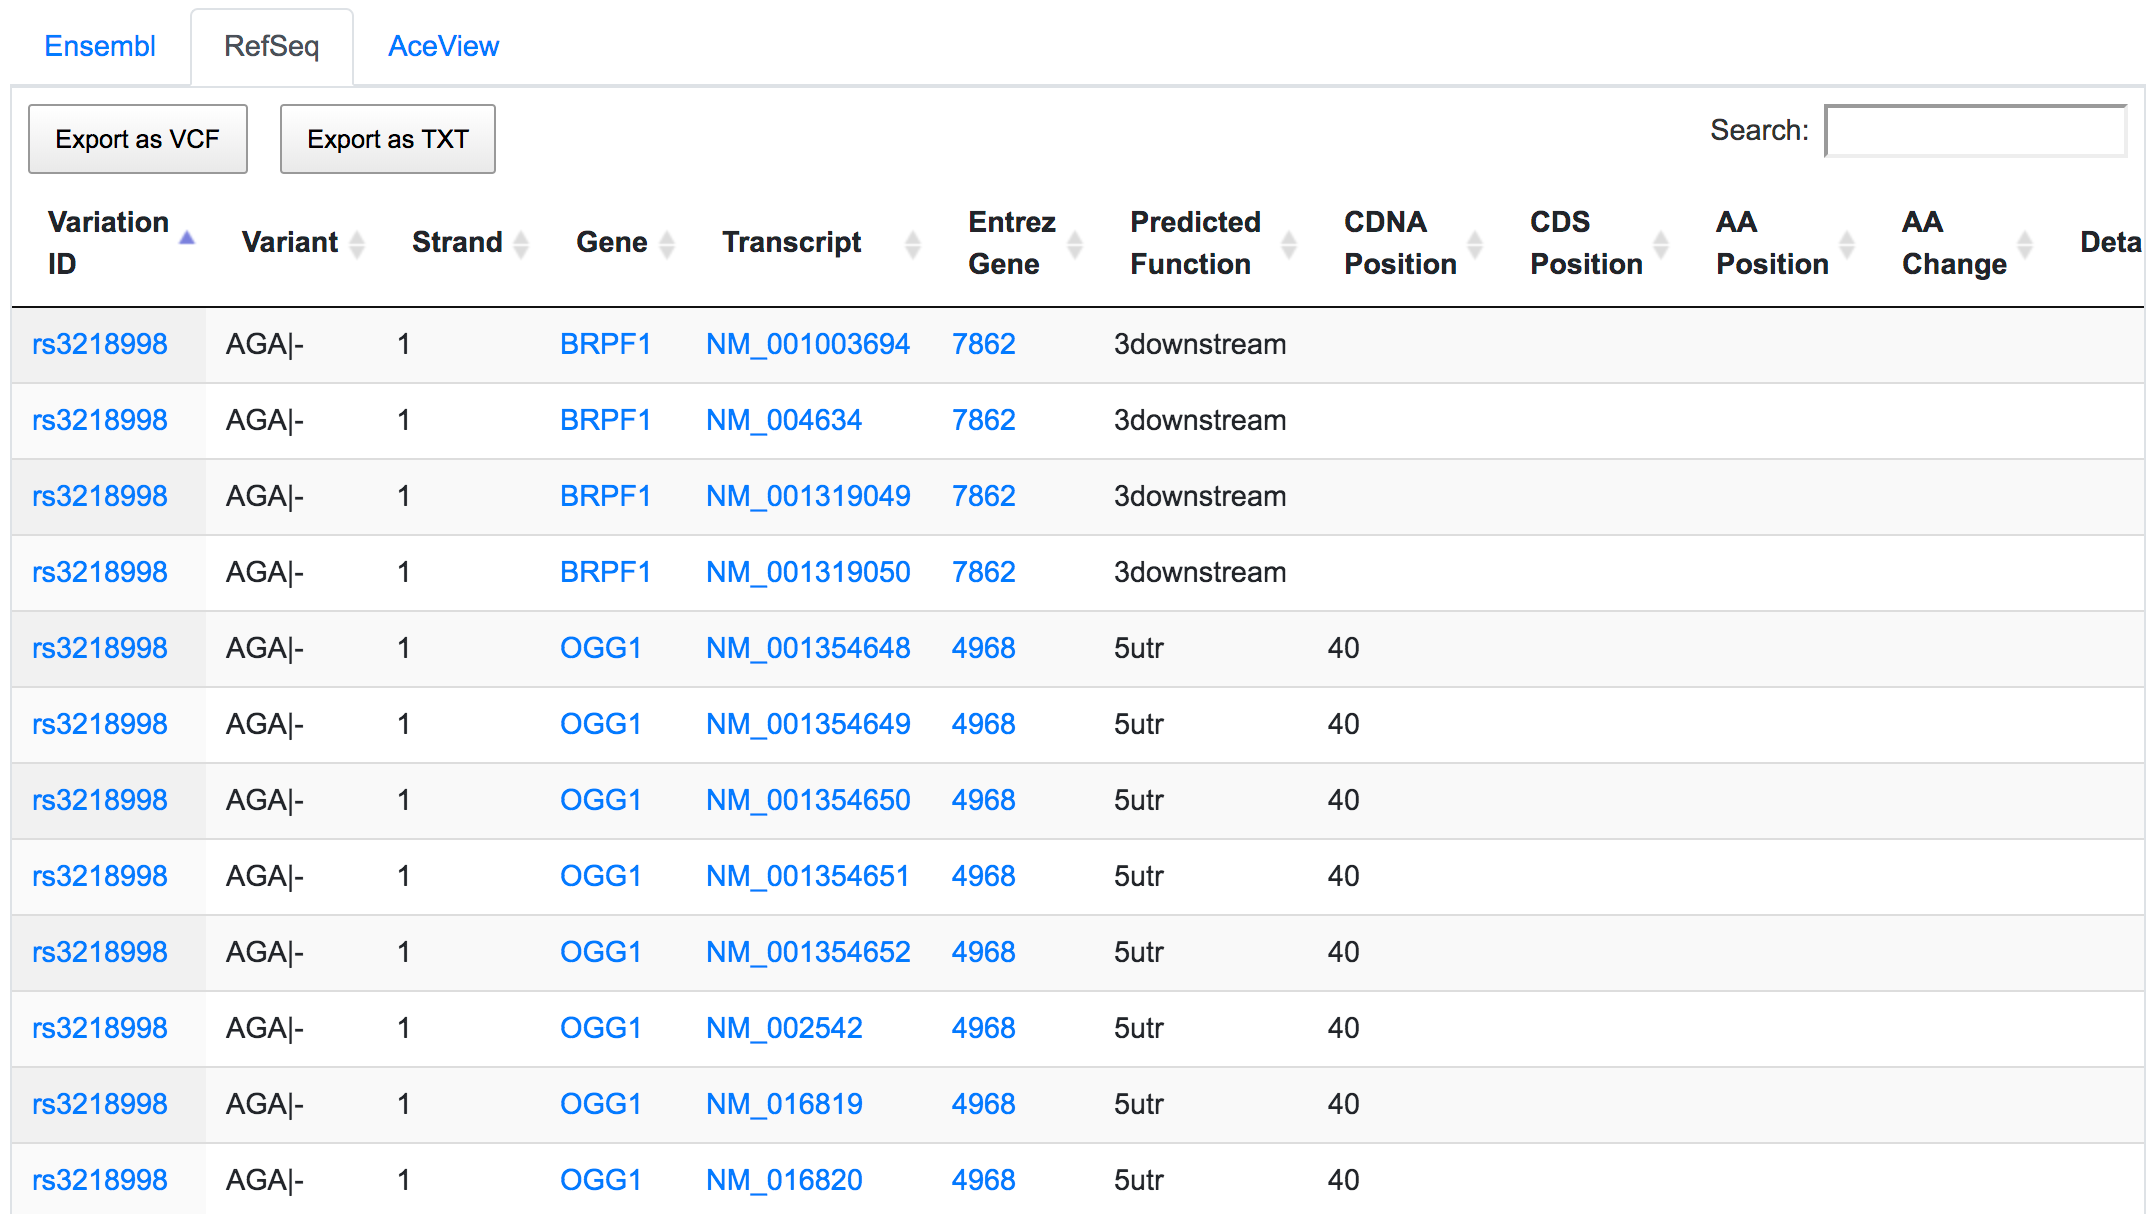
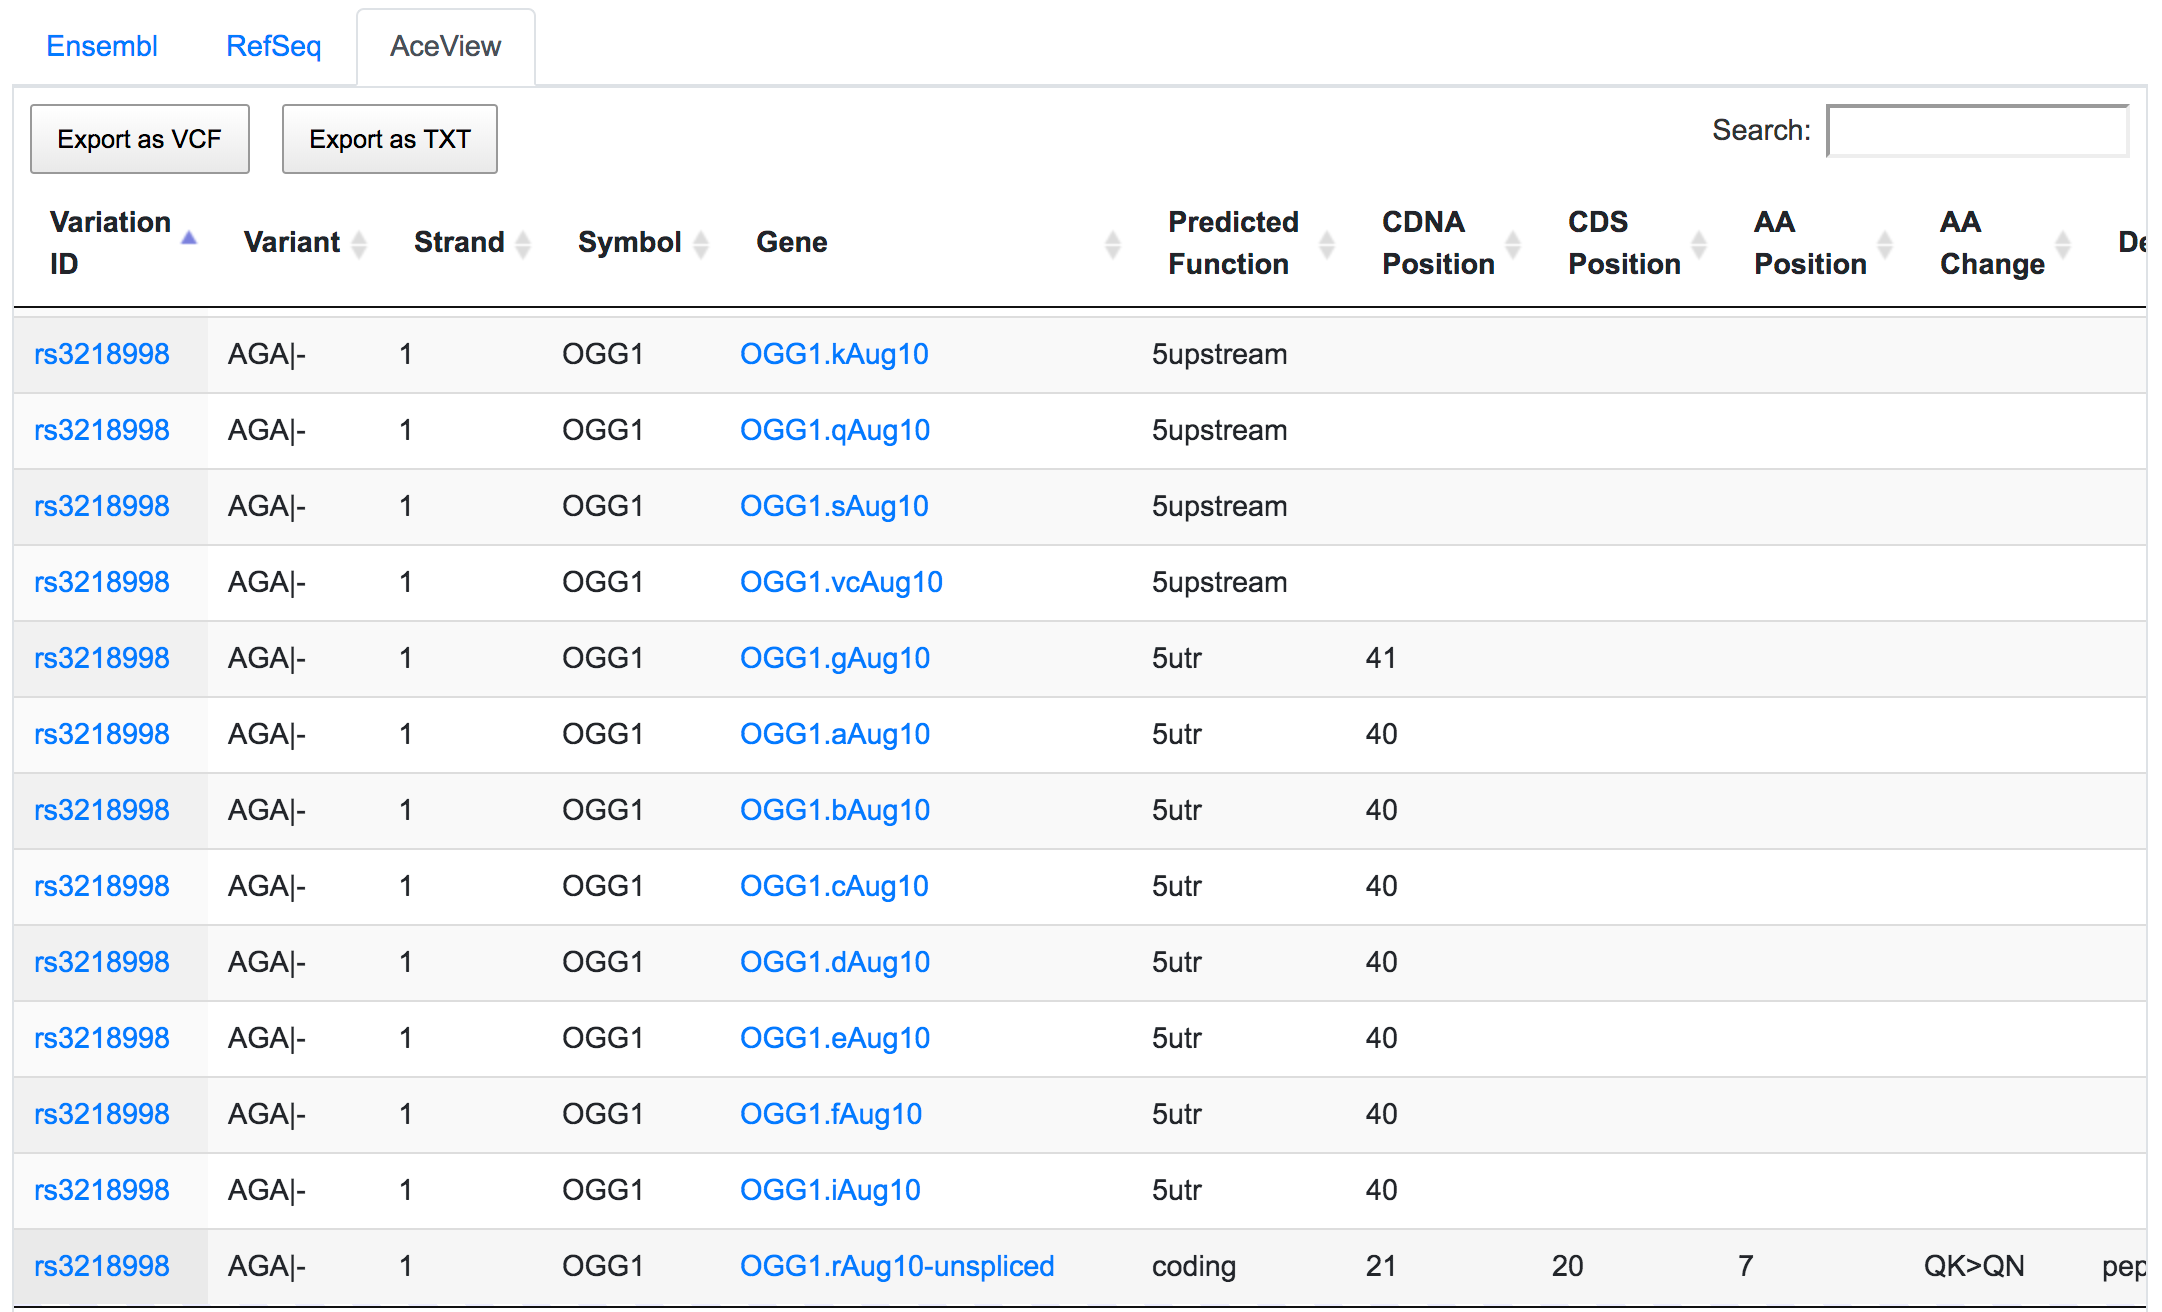
This is an example of how SNPnexus enables discovery of new potential functions that should be considered in any further analysis.
Identifying variants in promoter and regulatory elements
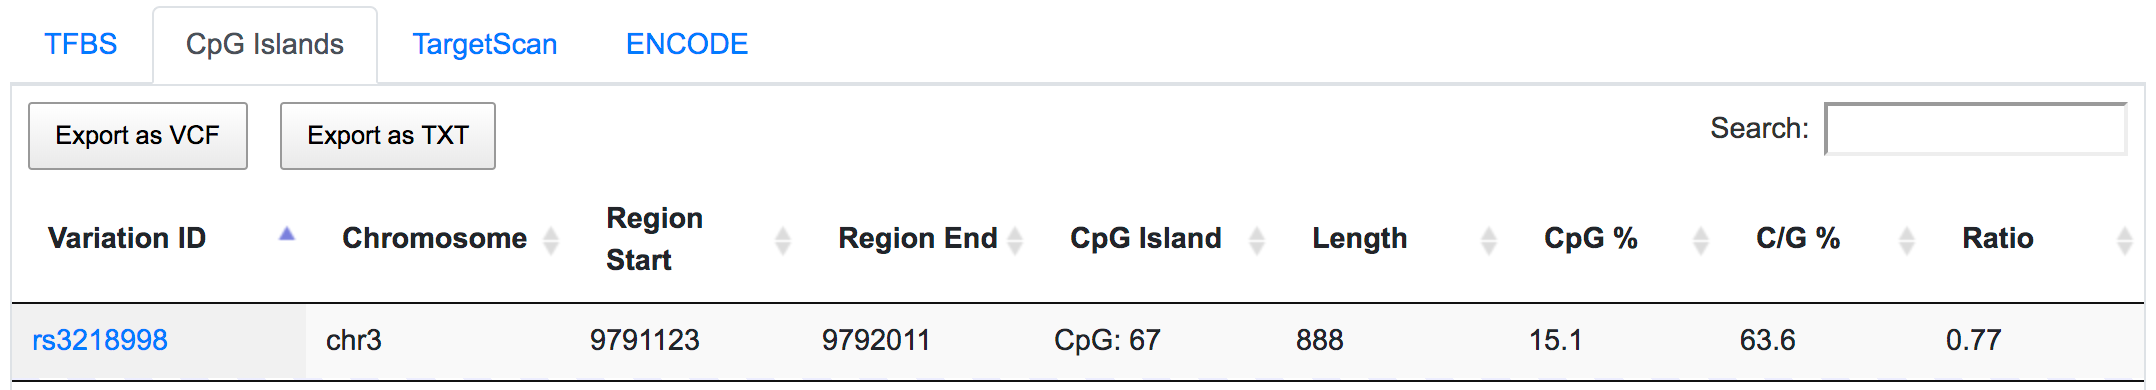
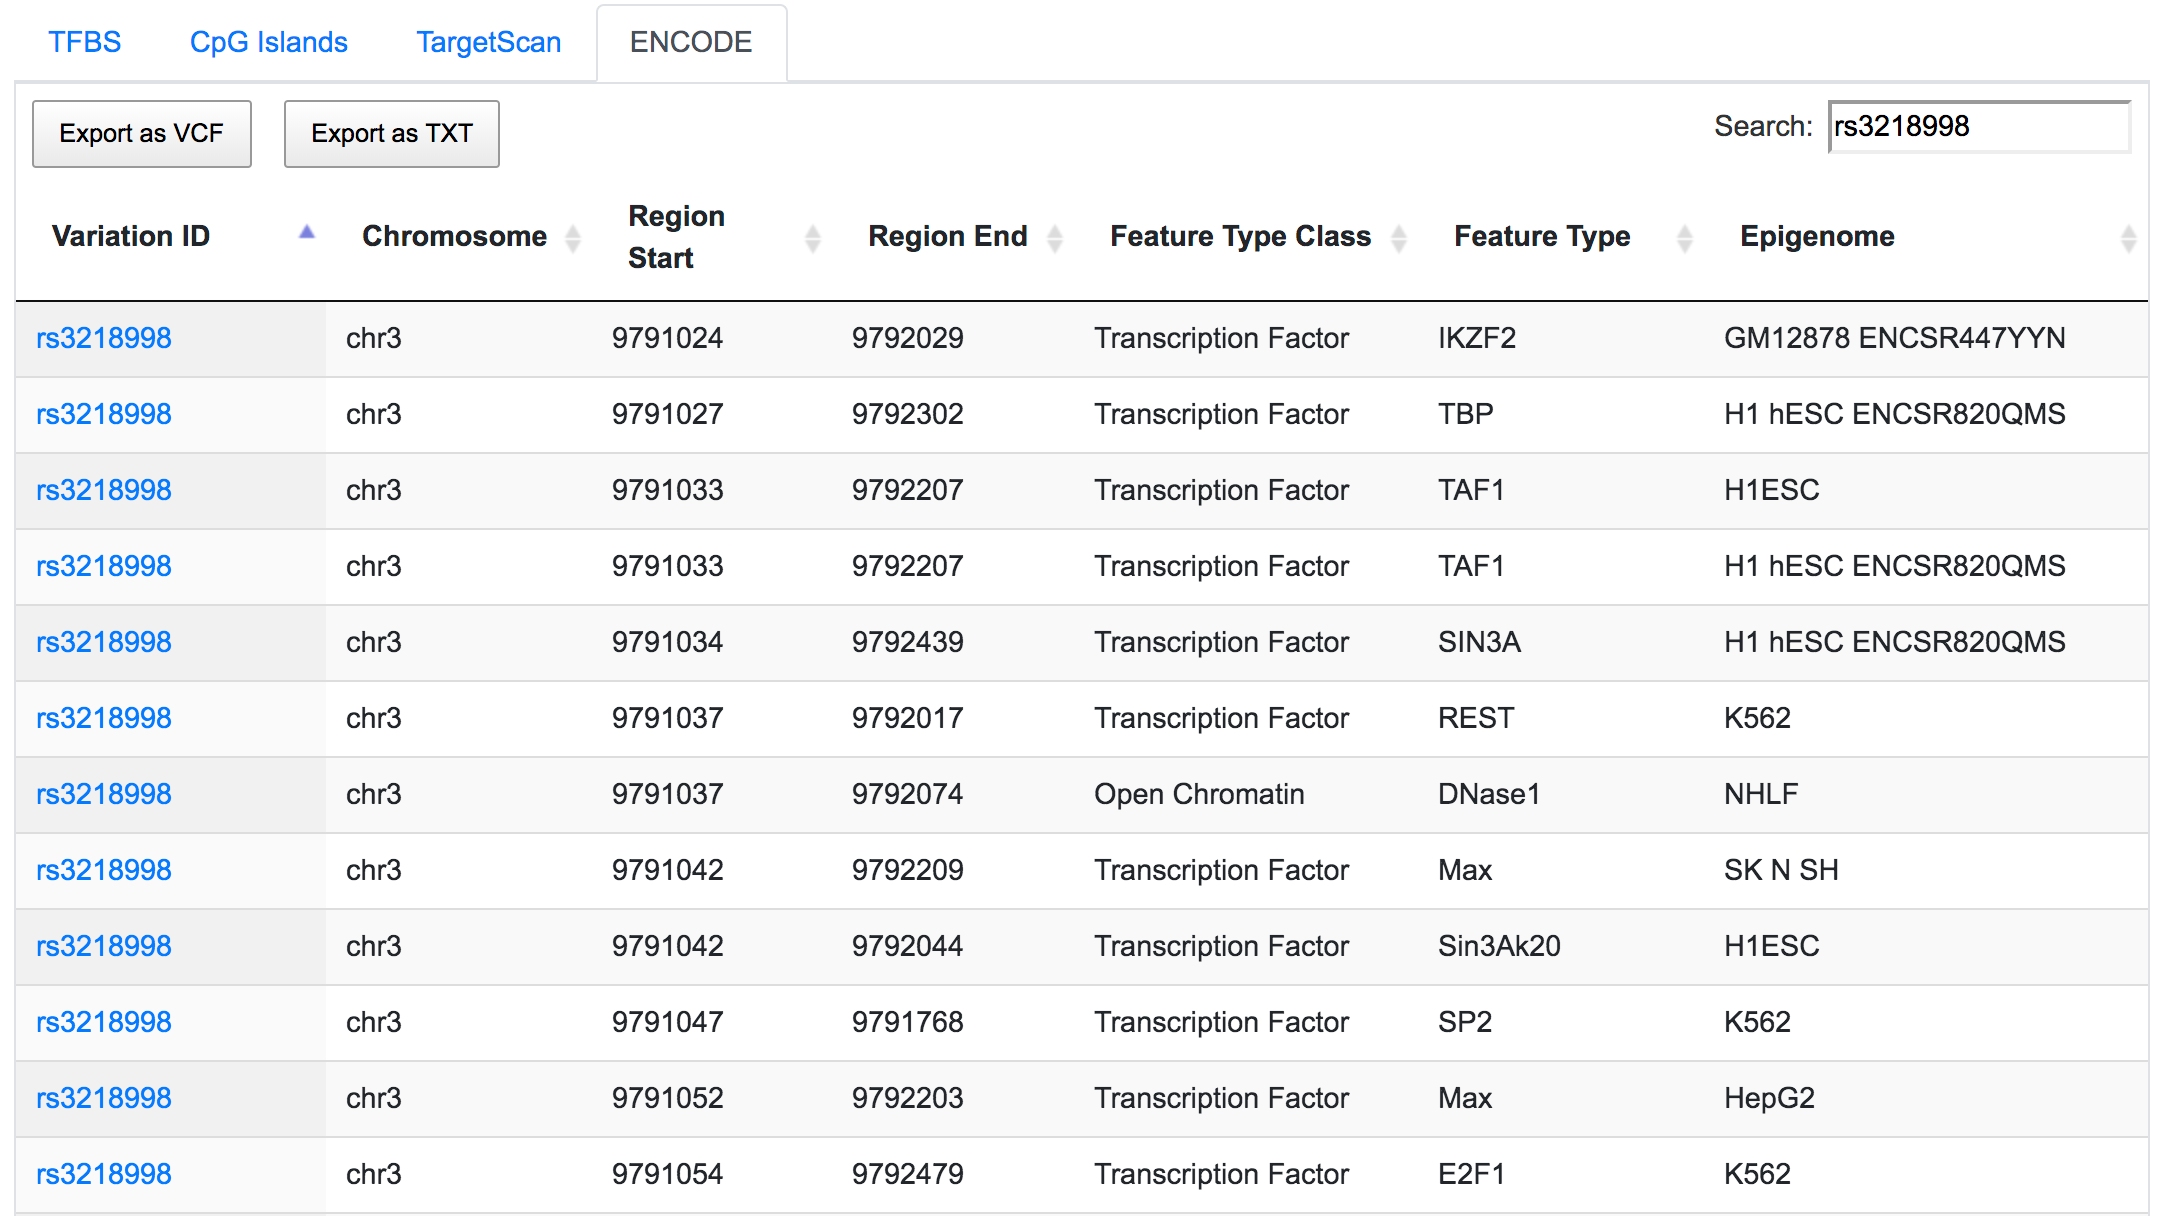
SNPnexus could be used to identify variants that occur in the highly conserved promoter or regulatory regions. SNPnexus located rs3218998 in a predicted CpG island, potentially affecting the transcriptional regulation of OGG1 gene.
The same SNP is also found to be located in the ENCODE-defined active promoter and enhancer regions.
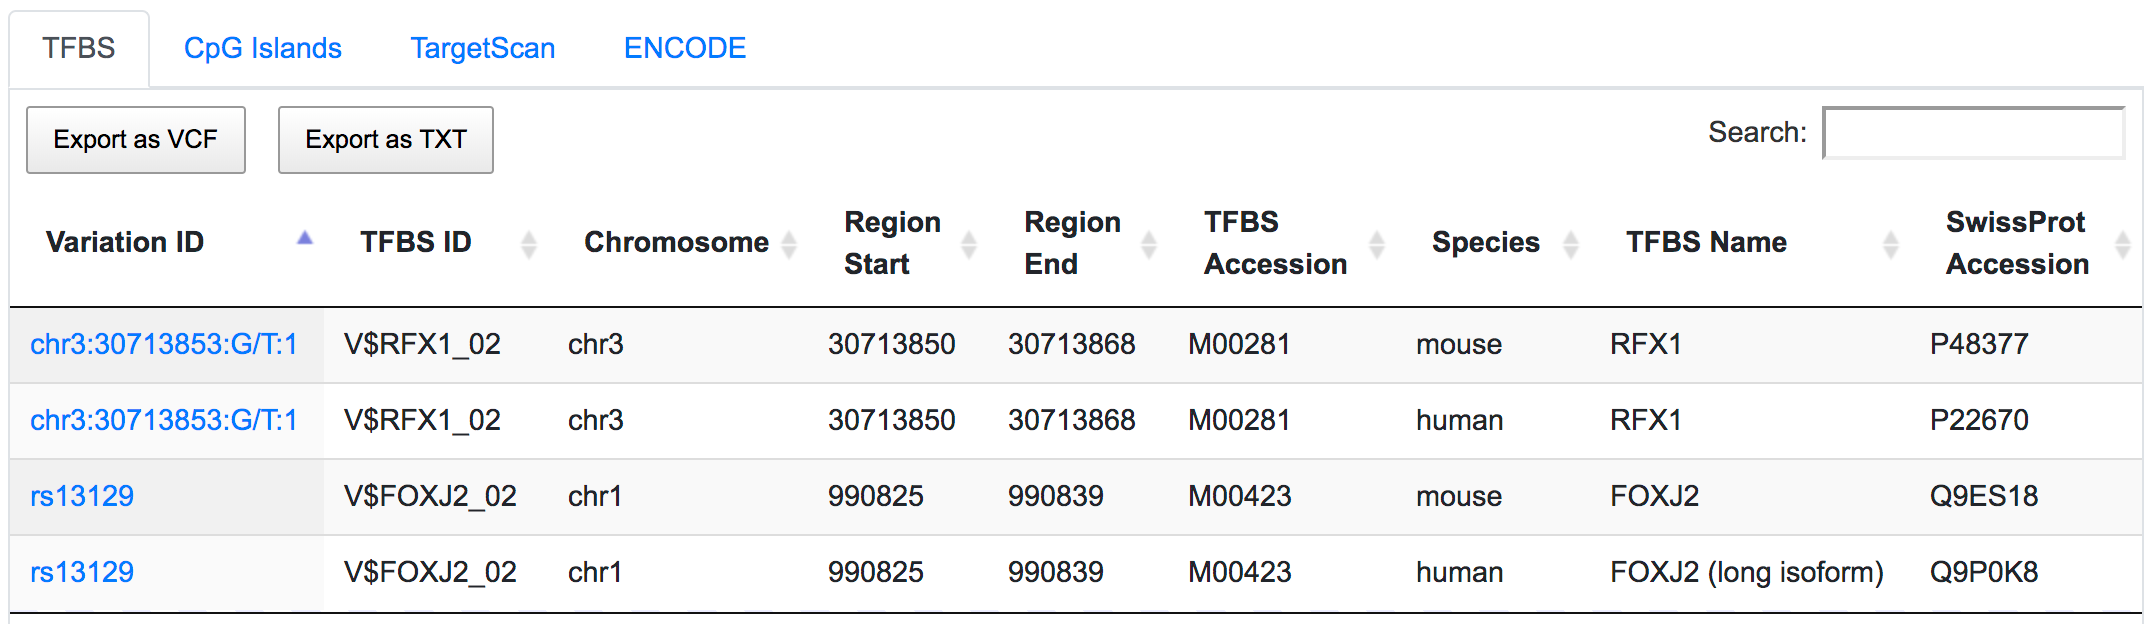
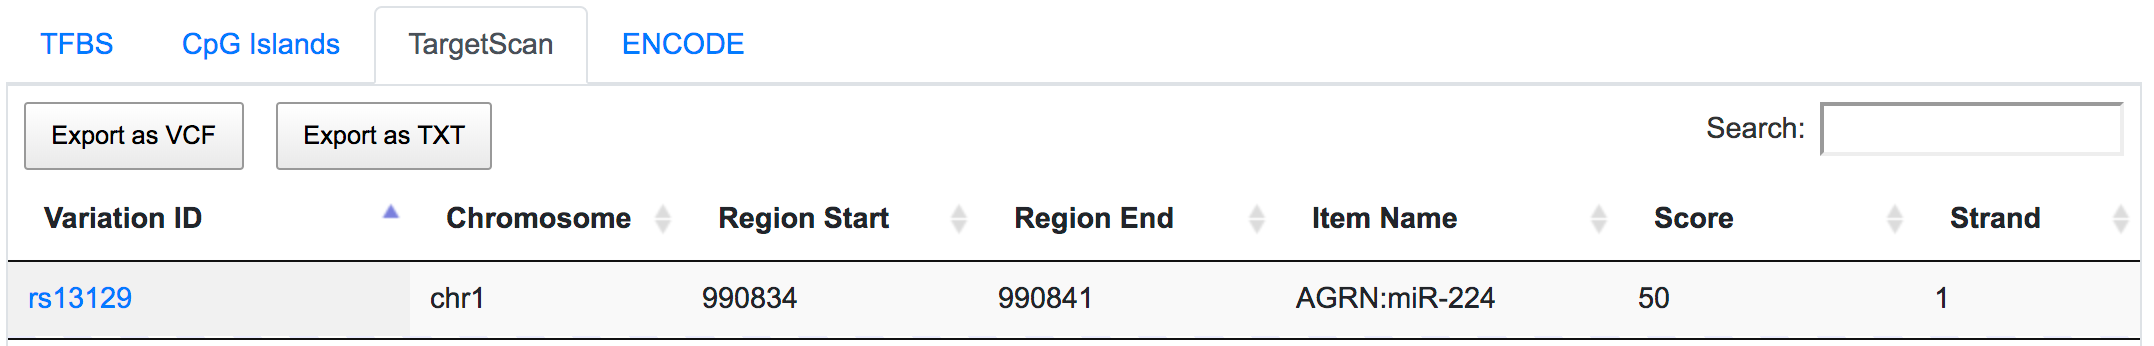
The variant chr3:30713853:G/T overlaps with the predicted binding sites of regulatory factor X1 (RFX1) gene. SNP rs13129 is found within the predicted binding sites of transcriptional activator Forkhead box J2 (FOXJ2) gene.
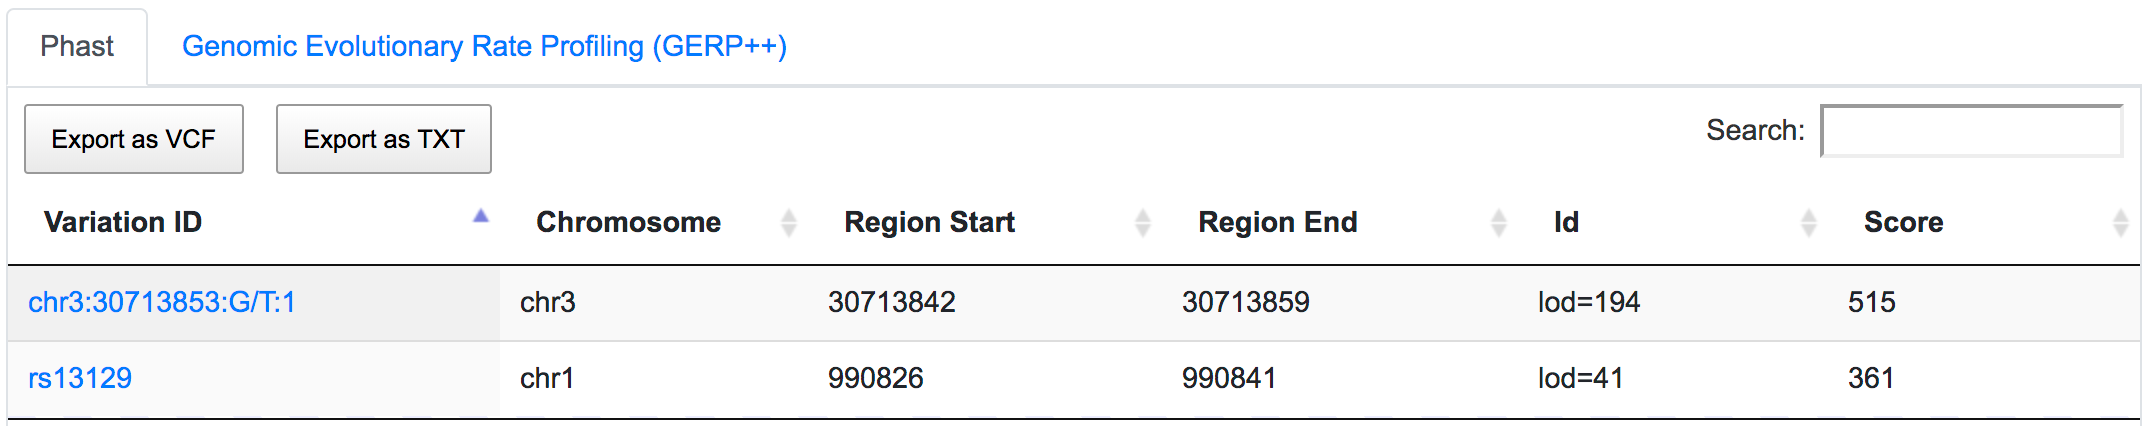
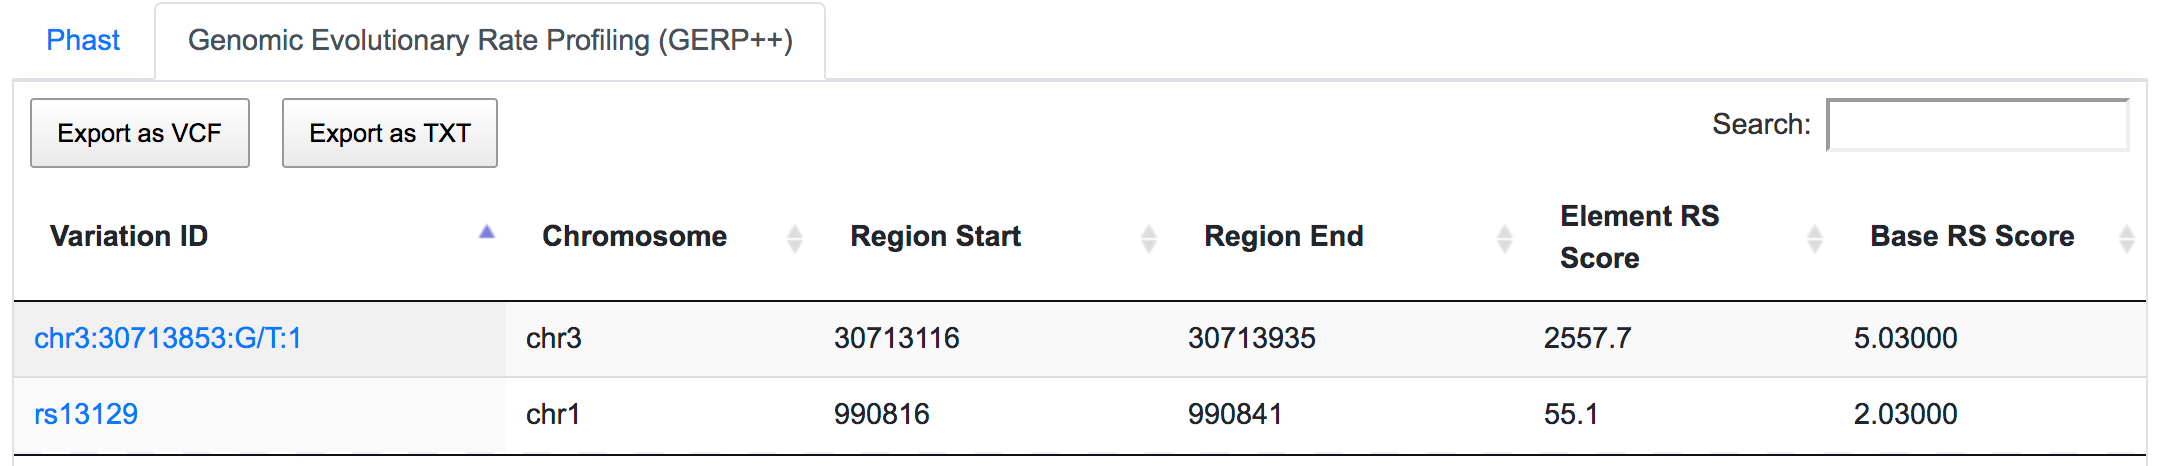
Both SNPs are also located in conserved regions.
rs13129 is also a potential miRSNP occurring in 3′-UTR of AGRN gene, a putative target site of miR-224.
Inferring association with diseases and populations
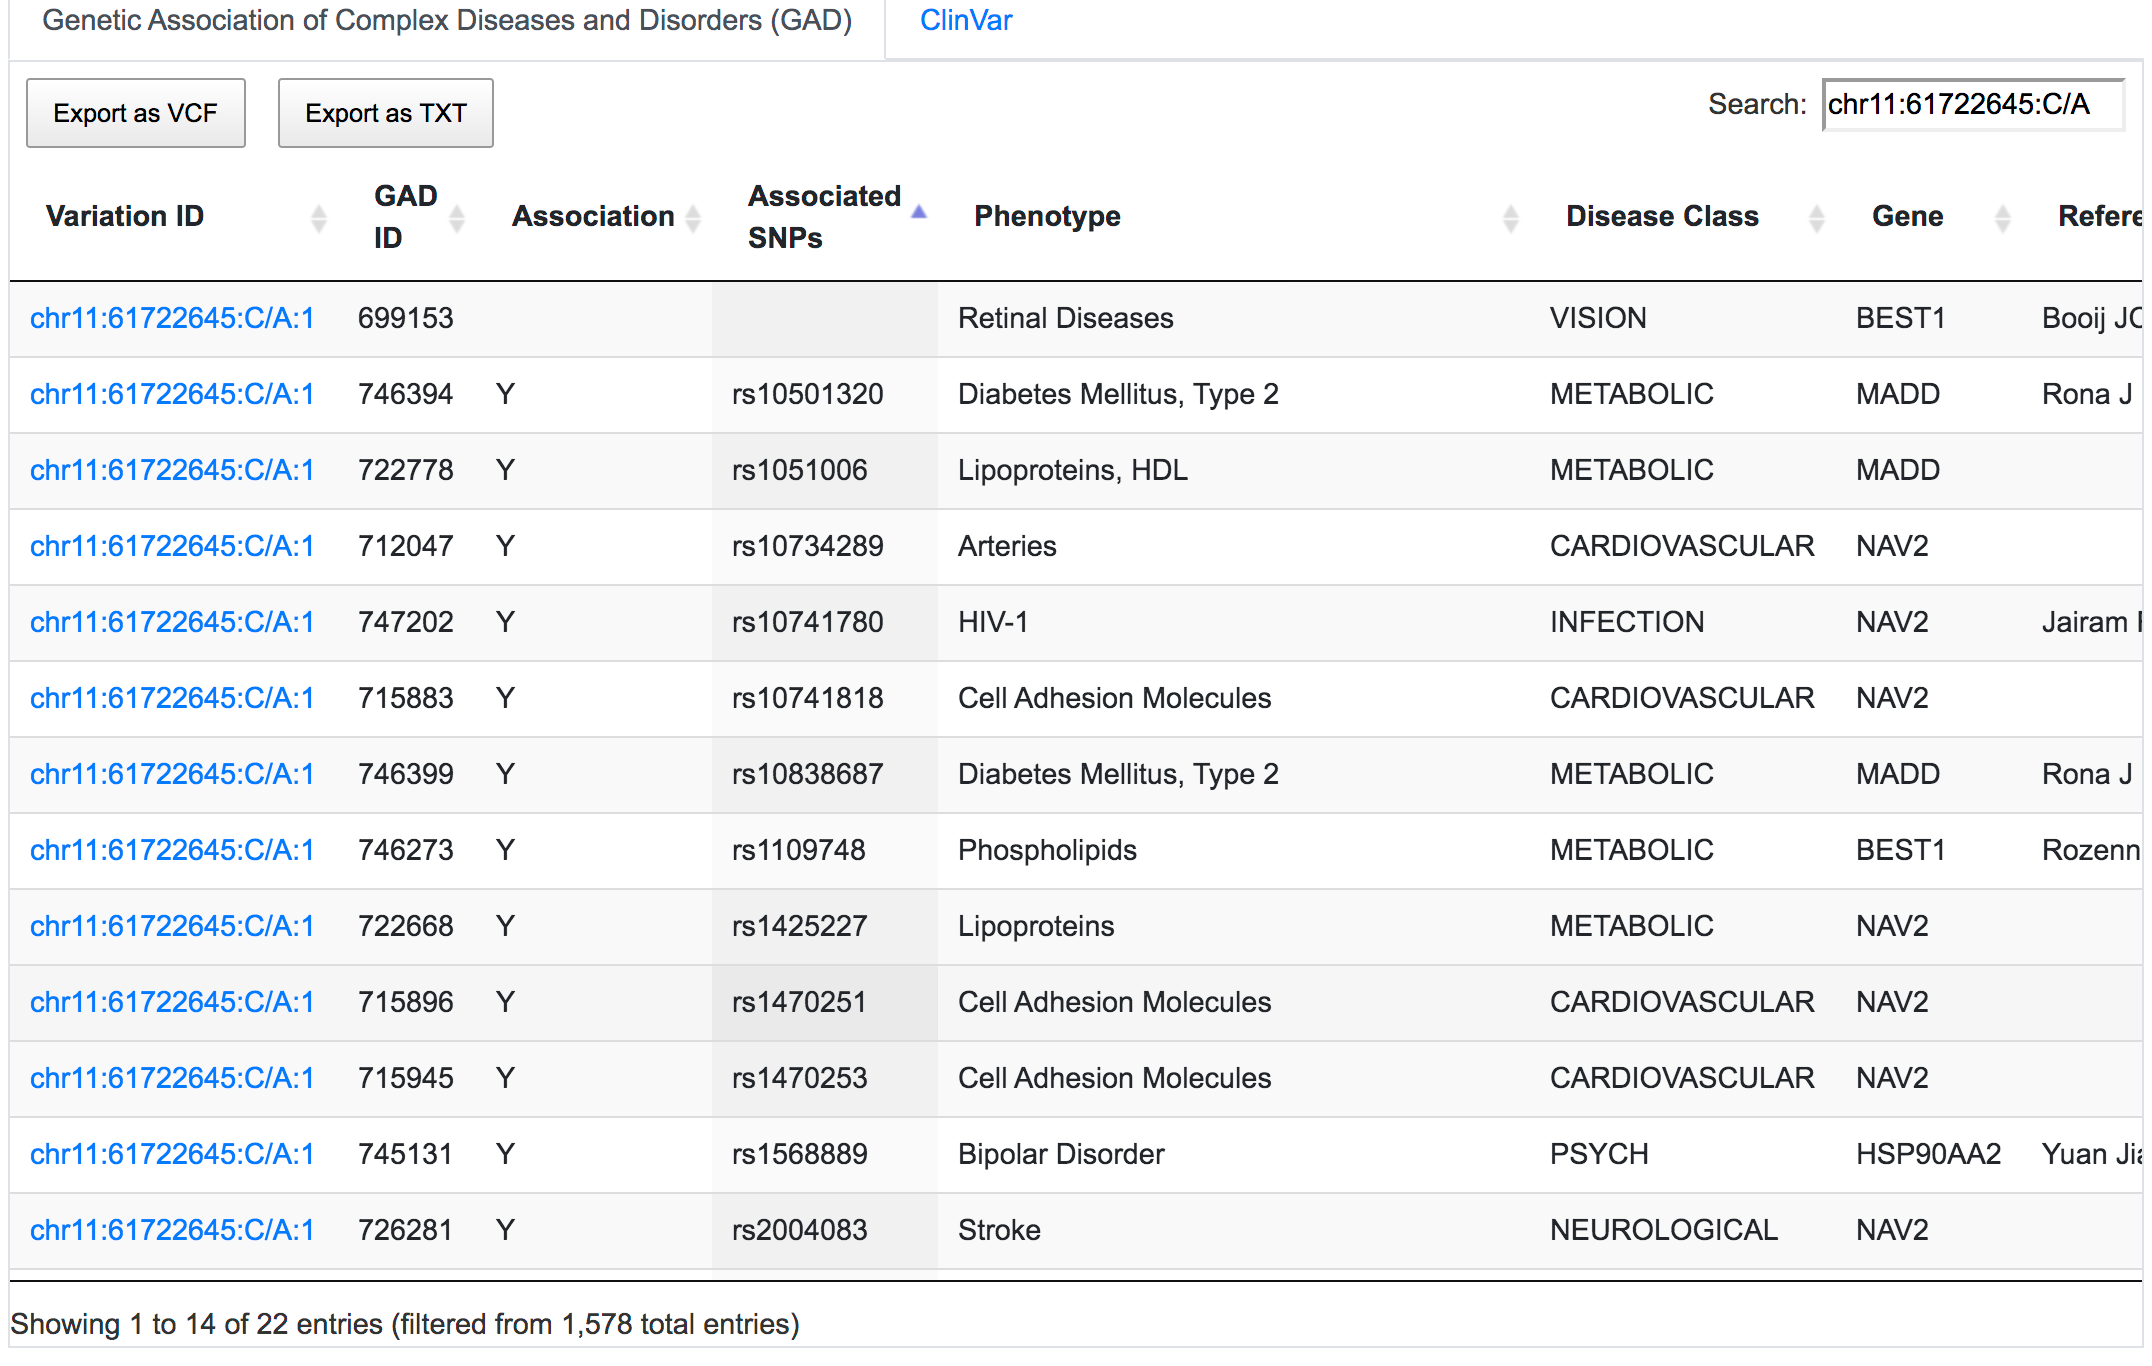
SNPnexus can report direct and indirect links between variants and known diseases/phenotypes using GAD (only for hg19), ClinVar, COSMIC and GWAS resources. Direct links indicate whether the given variant has been reported in previous studies. Indirect links are based on the gene containing the variant rather than the variant itself. For example, rs1109748 (chr11:61722645:C/A) is a variant found in the sequence of the BEST1 gene. SNPnexus identified 22 GAD entries connecting rs1109748 with various diseases, most of which are indirect links, as it is the gene BEST1 that has been studied in these reports. Only 1 entry is a direct link, as they focus on rs1109748.
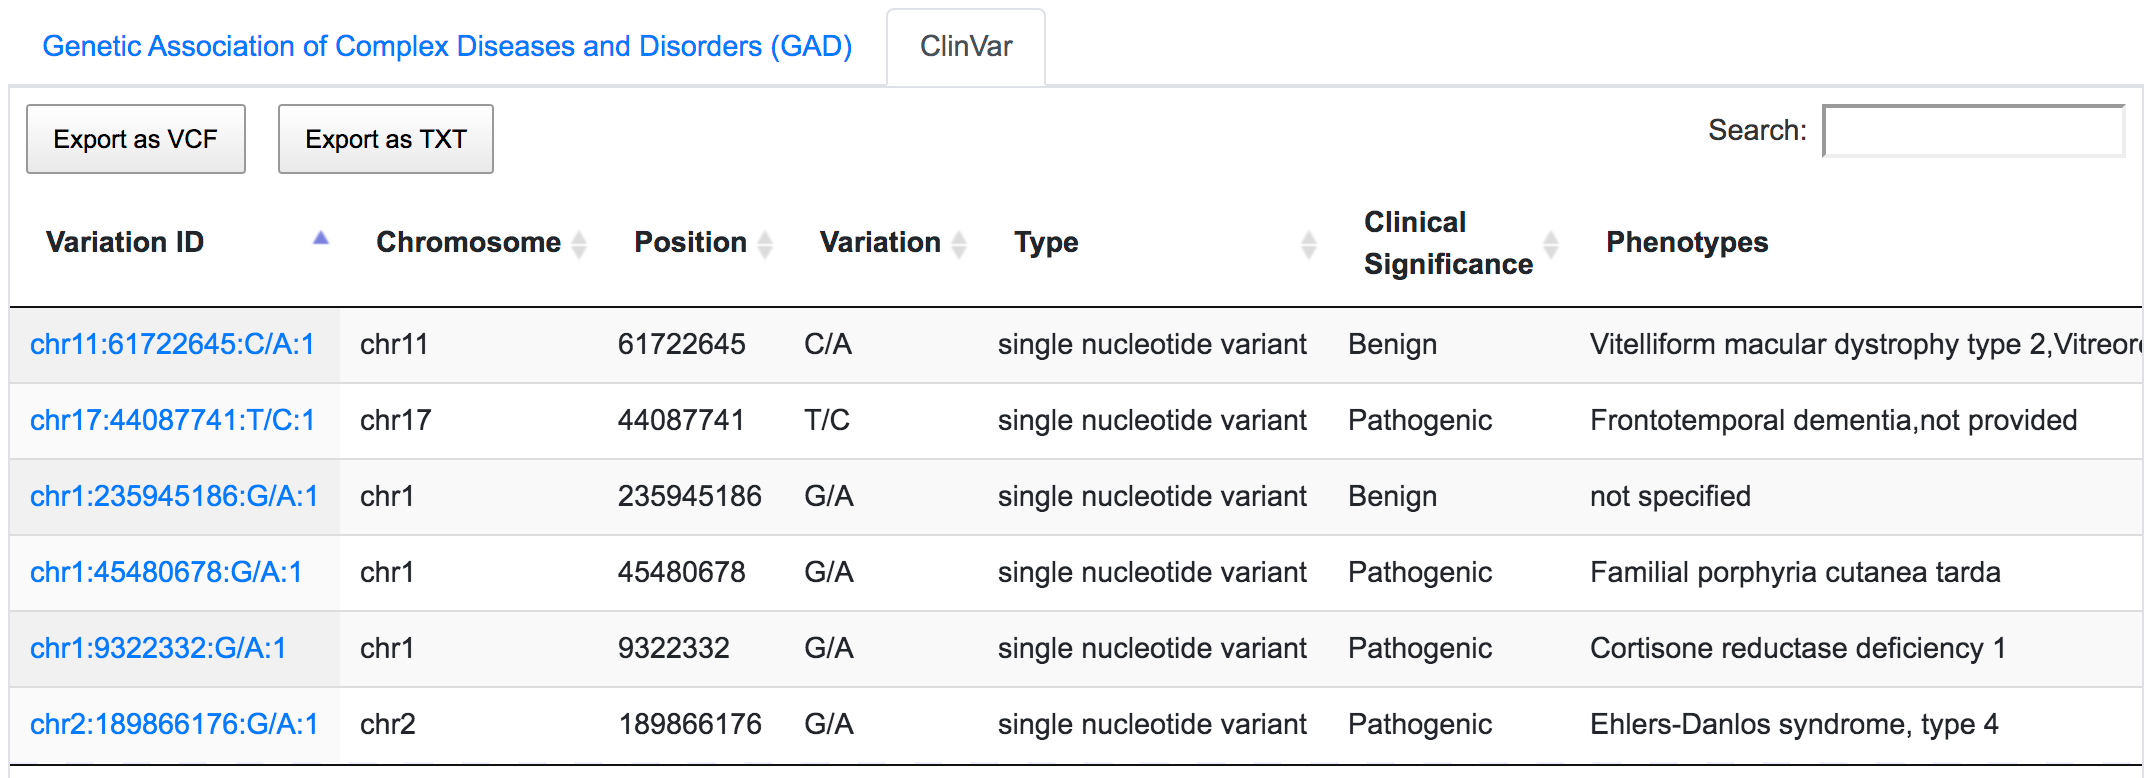
Mining ClinVar database reveals that rs1109748 (chr11:61722645:C/A) is related to many phenotypes however has a benign clinical significance.
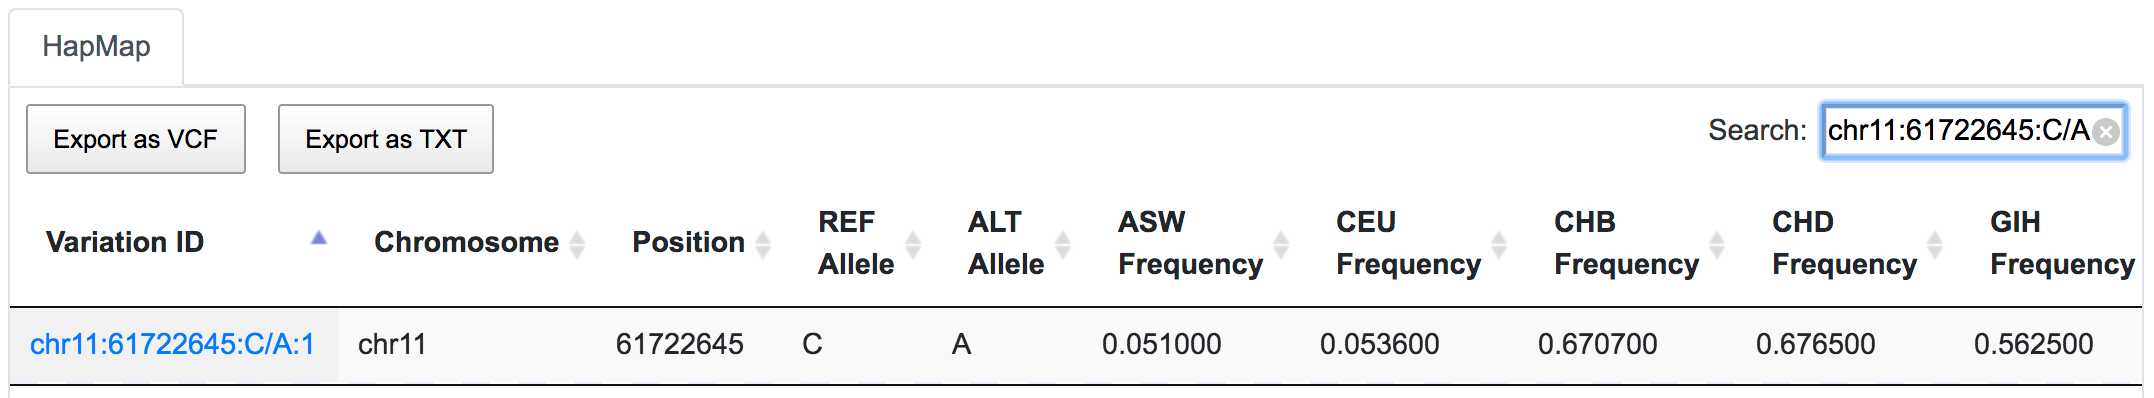
It is also possible to combine disease association database results with the population genotype data.
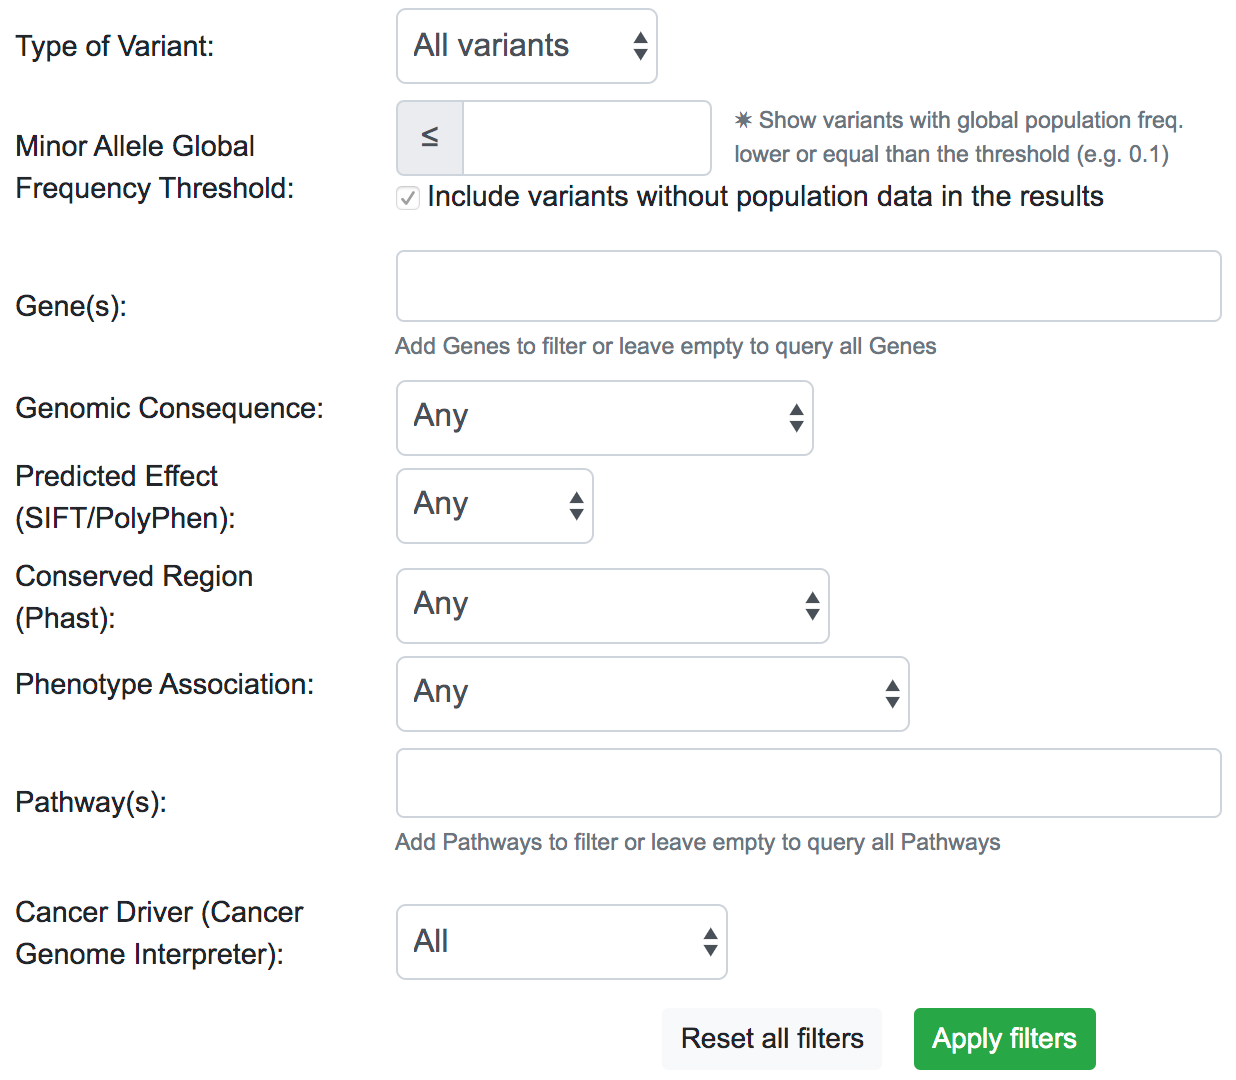
The filtering system is a novel addition to the latest update of SNPnexus. It is built with the idea to streamline the variant prioritisation in a large queryset. The user can filter variants based on different features:
- Type of Variant: It is possible to show only variants that map with a known dbSNP or novel variants not present in the dbSNP database.
- MAF Threshold: The user can opt for only showing variants that have a Minor Allele Frequency lower than a threshold. This filter uses data from Ensembl for the global population. For the case where there is no information available for the variant, the default action is to include the variant in the filtered results.
- Gene(s): SNPnexus presents the user a list of all the genes related to the variants queryset and allows the user to focus on the variants related to the genes selected.
- Genomic Consequence: Using data from all the Genomic Consequence annotations selected by the user for the queryset, SNPnexus can filter the results based on if the variant is UTR, Intronic, Coding Synonymous or Coding Non-Synonymous.
- Predicted Effect: Using data from SIFT, PolyPhen, or both, SNPnexus allows the user to filter variants depending on its predicted deleteriousness (Benign or Damaging). This filter is only available if the user selected at least SIFT or PolyPhen for the queryset.
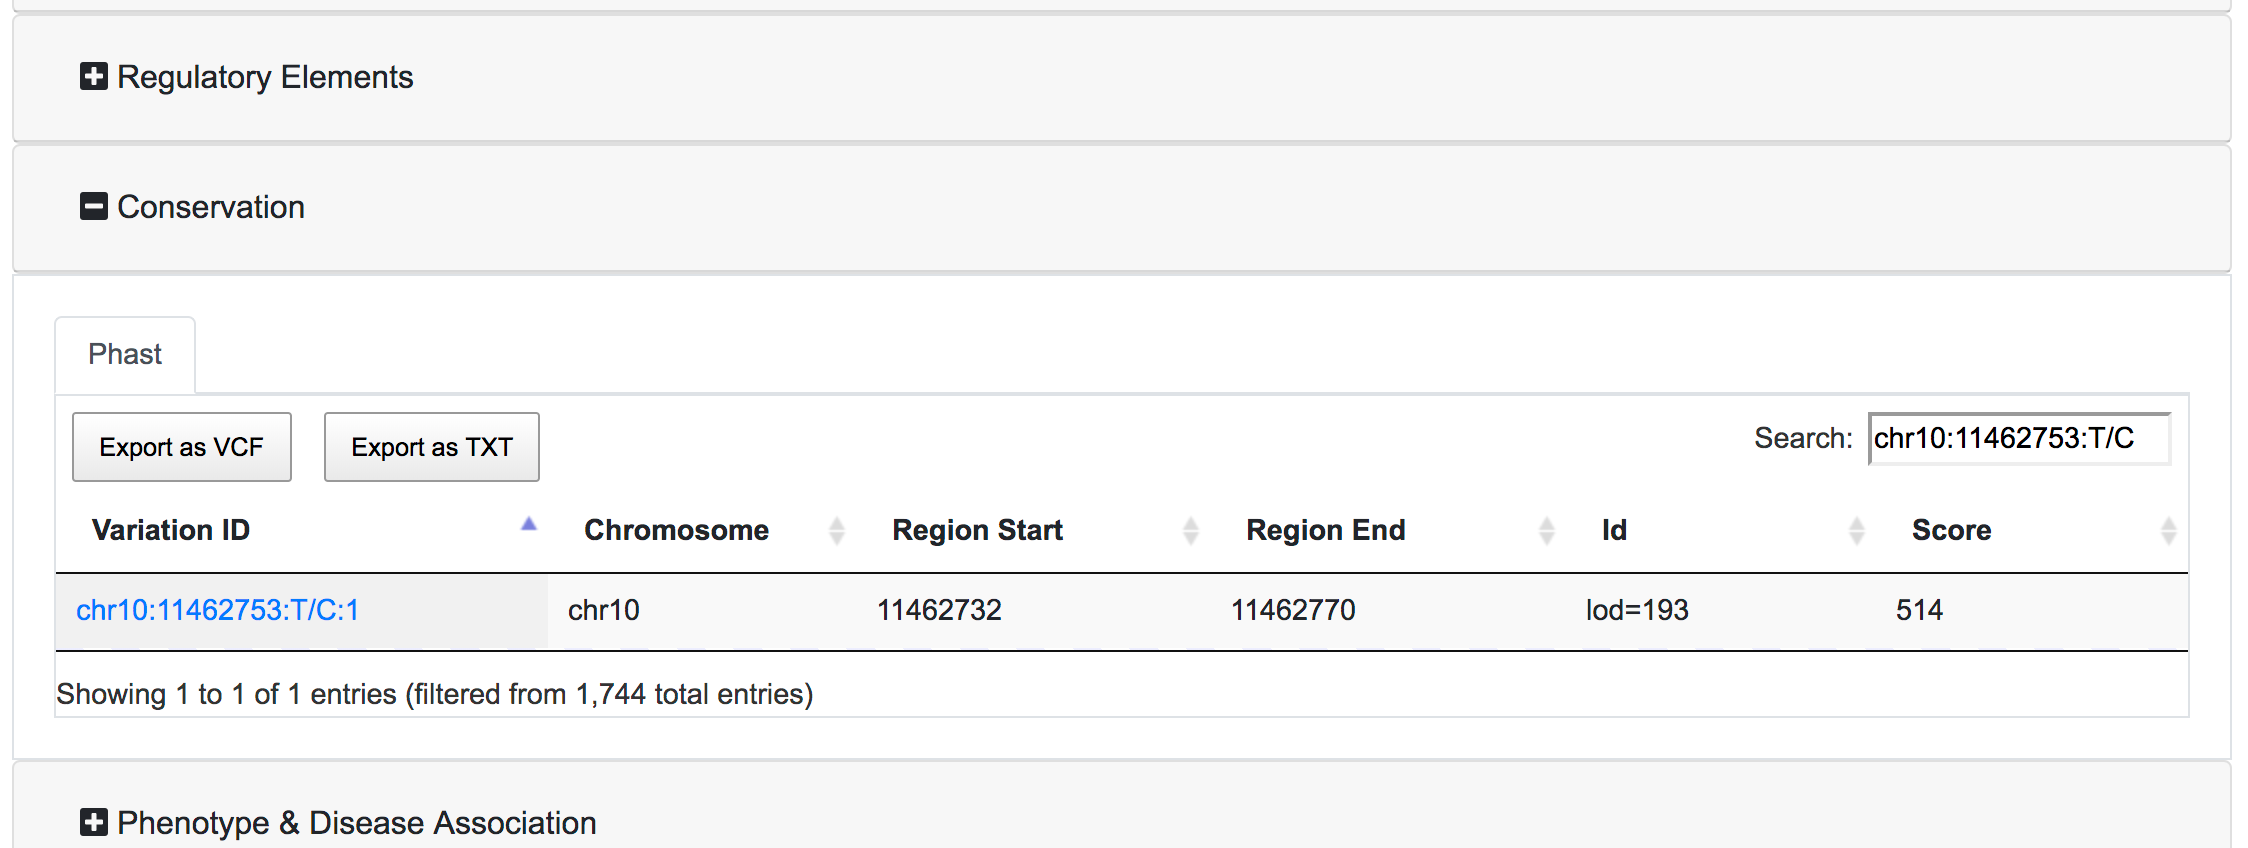
- Conserved Region: SNPnexus can filter variants that lay within a conserved region (using data from Phast) or, alternatively, variants outside any conserved region. This filter is only available if the user selected the Phast annotation for the queryset.
- Phenotype Association: It is possible to filter variants that have a known phenotype association using data from ClinVar and COSMIC, or variants that do not have any association. This filter is only available if the user selected ClinVar or COSMIC for the queryset.
- Pathway(s): SNPnexus shows the user a list of all Reactome Pathways associated with the genes involved in the queryset. It is possible to select one or more pathways to focus the analysis of the variants. This filter is only available if the user selected the Pathway Analysis for the queryset.
- Cancer Driver: Filter variants based on their oncogenic classification, using data from the Cancer Genome Interpreter. It is possible to show only variants that are known or predicted cancer drivers; or otherwise, show variants that are polymorphisms found at a major allele frequency higher than 1% across the population.
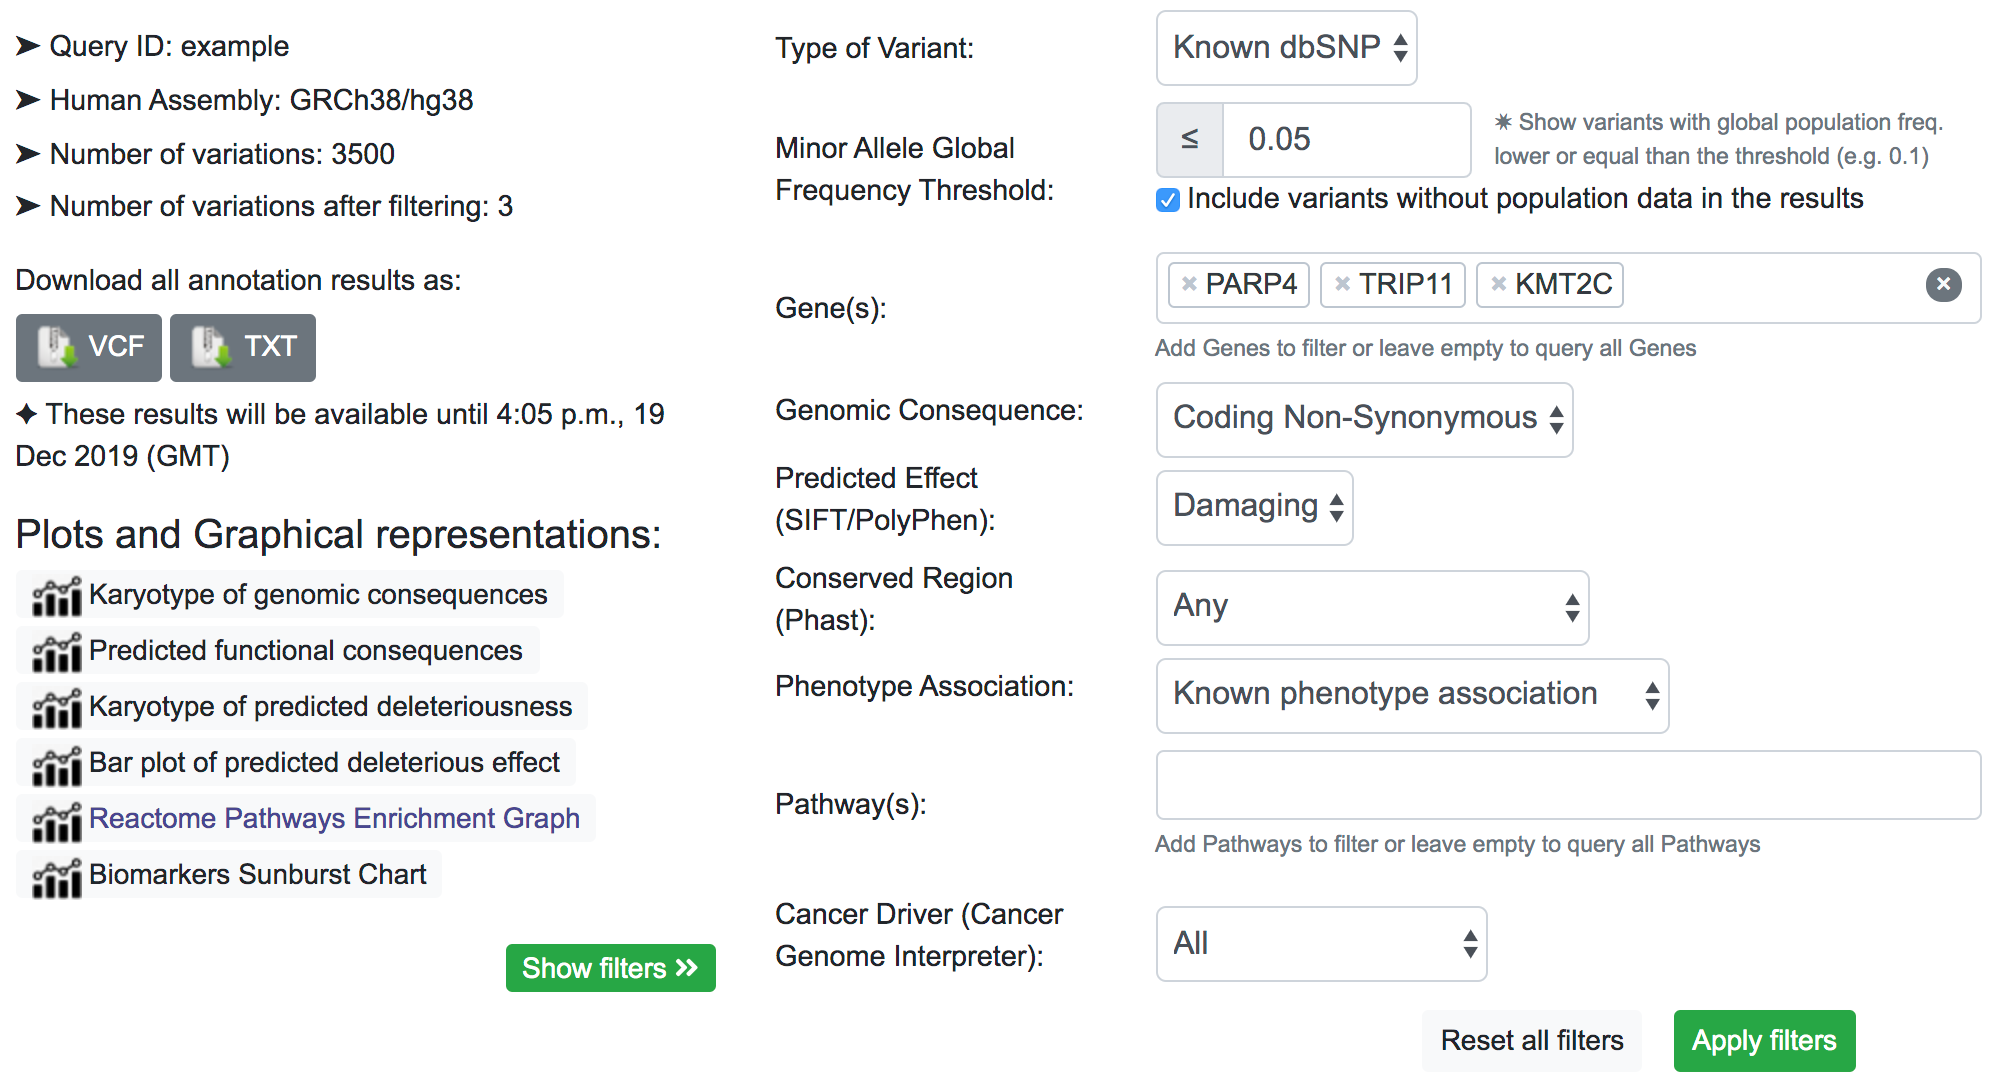
The example below shows the process of prioritisation for possible phenotypic variants from a queryset of 3500 variants. The example results page can also be navigated from here
First, we focus only on the variants that map to known SNPs in the dbSNP resource. After filtering, SNPnexus reports that the number of variants mapped to dbSNP is 2420.
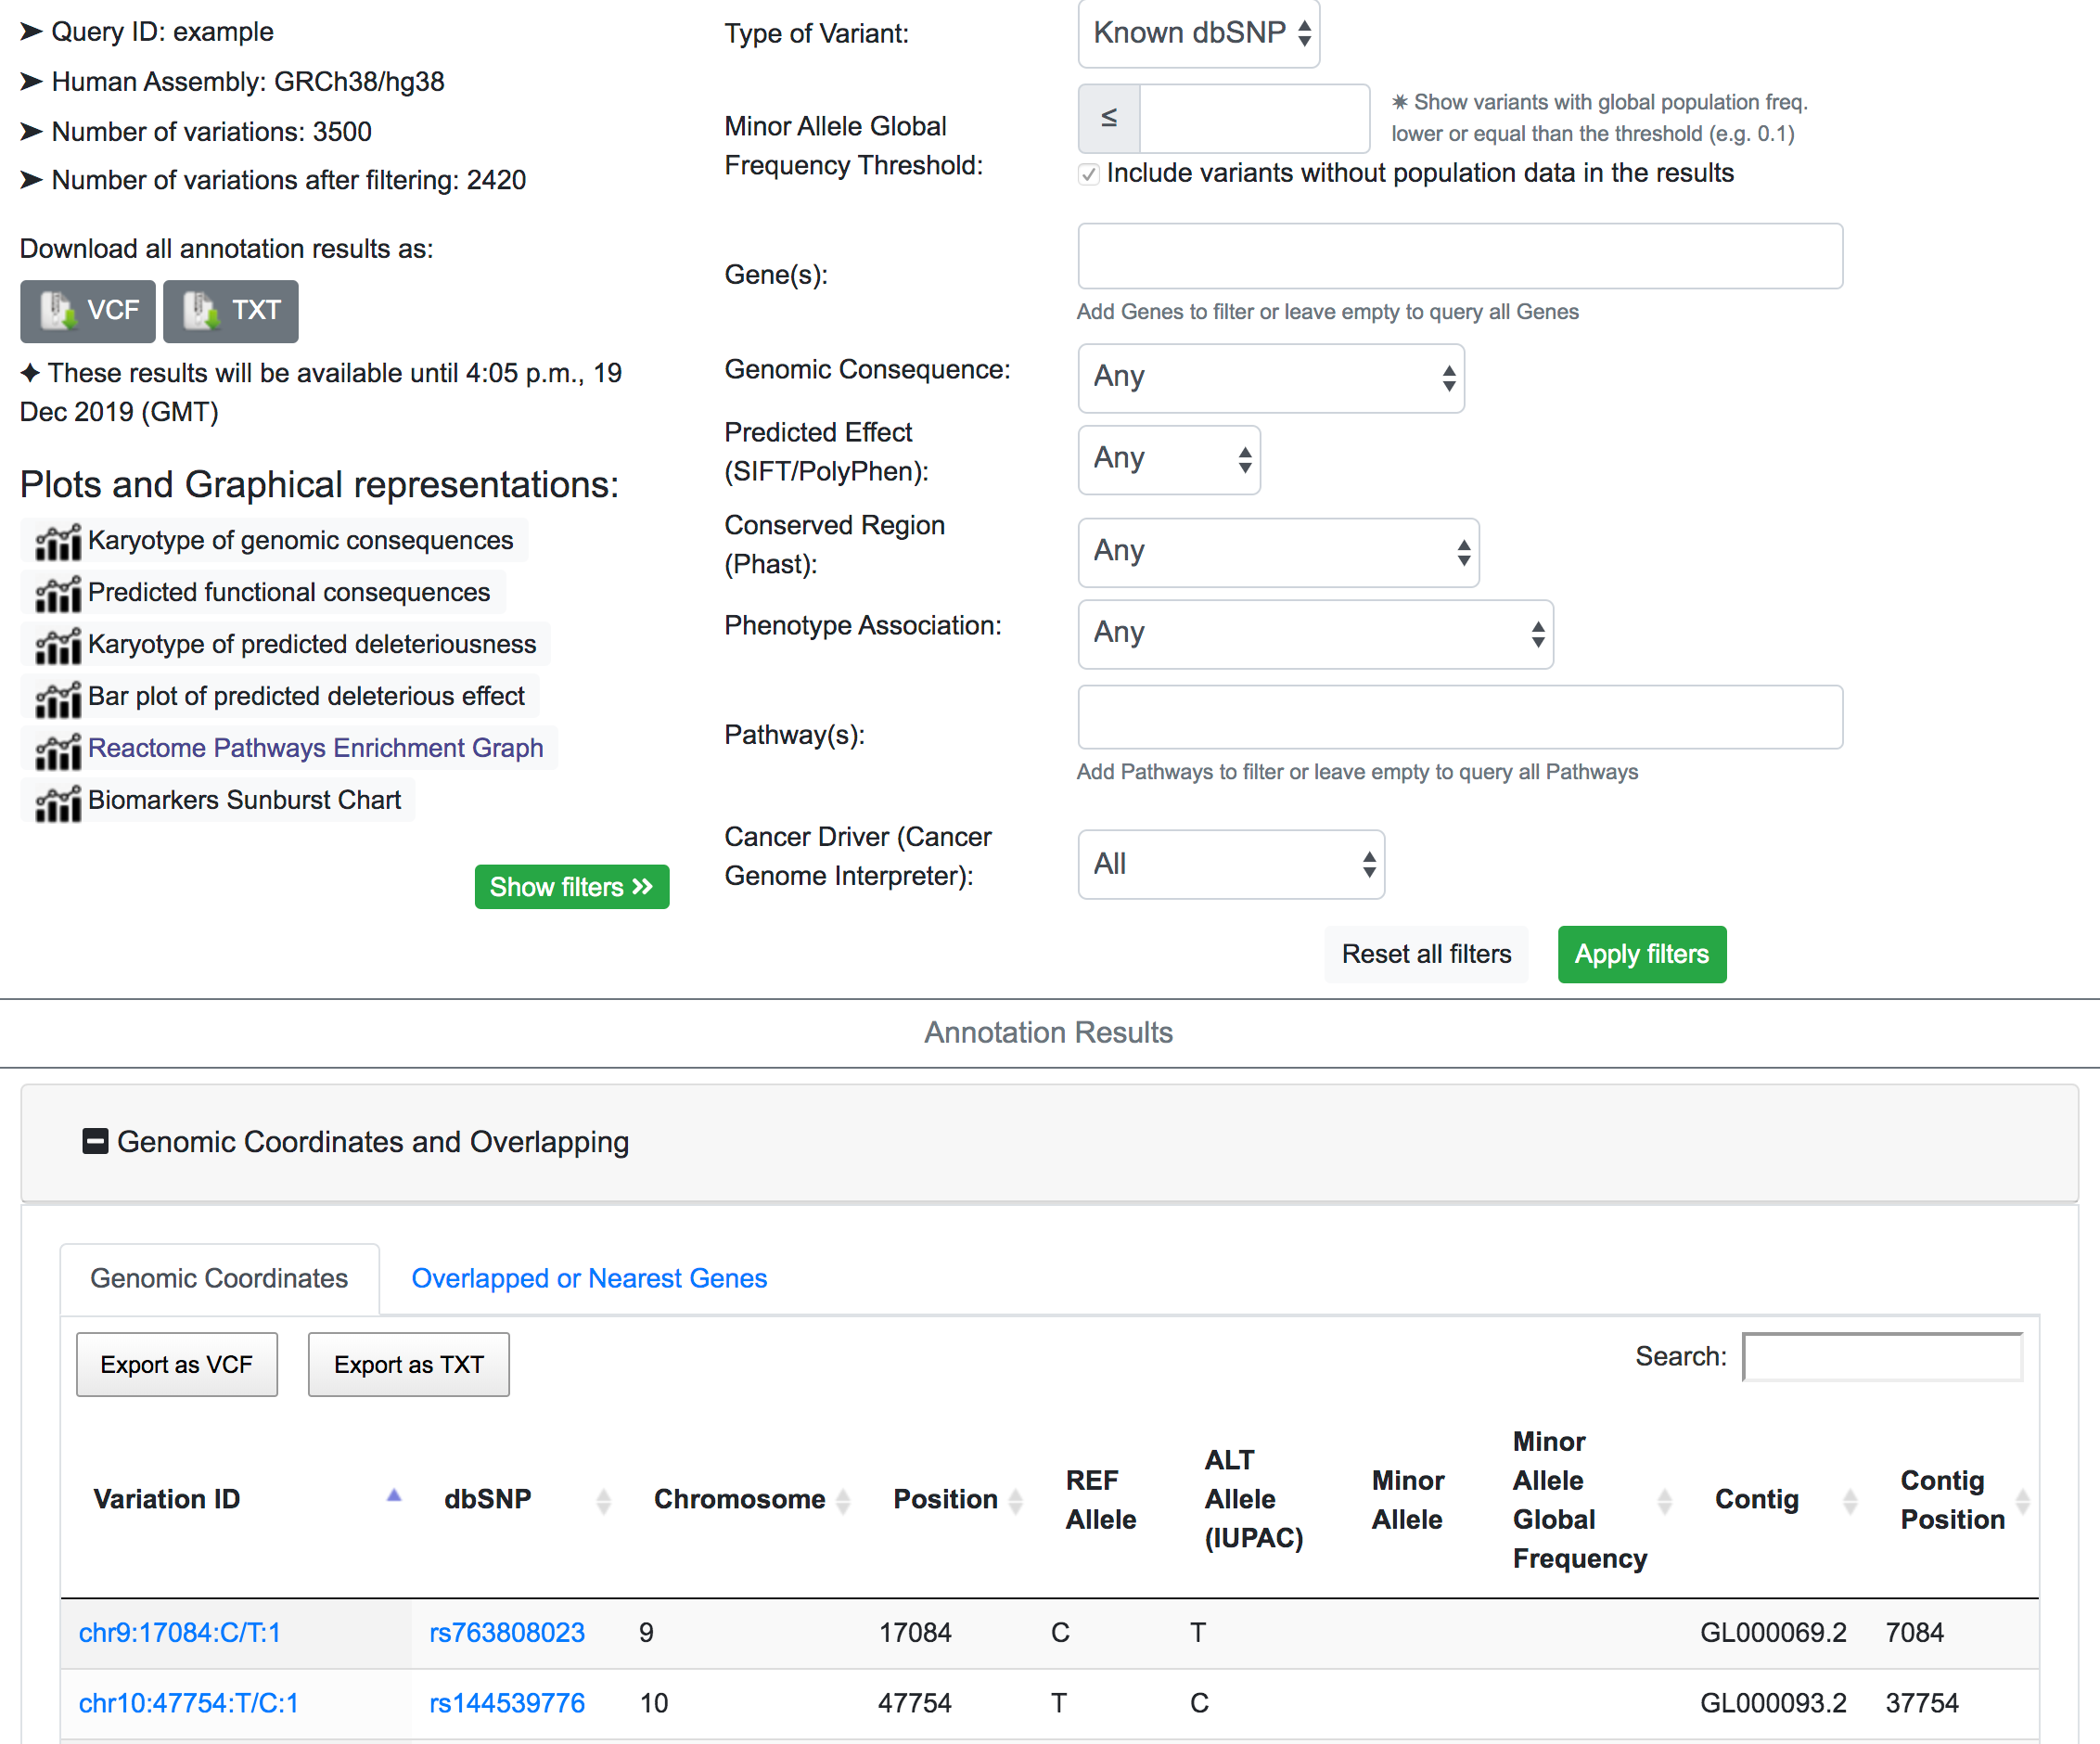
If we are interested in a rarely prevalent disease, it is logical to assume that the relevant genomic variants have a very low global frequency. In this example, a MAF threshold of 0.05% is applied, which returns 1257 variants of interest.
At this stage, we can see in the genomic consequences that most of the variants are intronic, UTR, non-coding or in the downstream or upstream. In the same way, if we analyse the predicted effect on protein functions, the majority of variants are predicted to be benign or tolerated.
The next step would be to focus on coding variants with non-synonymous prediction. We can go a bit further and at the same time show only variants with a predicted deleterious protein function.
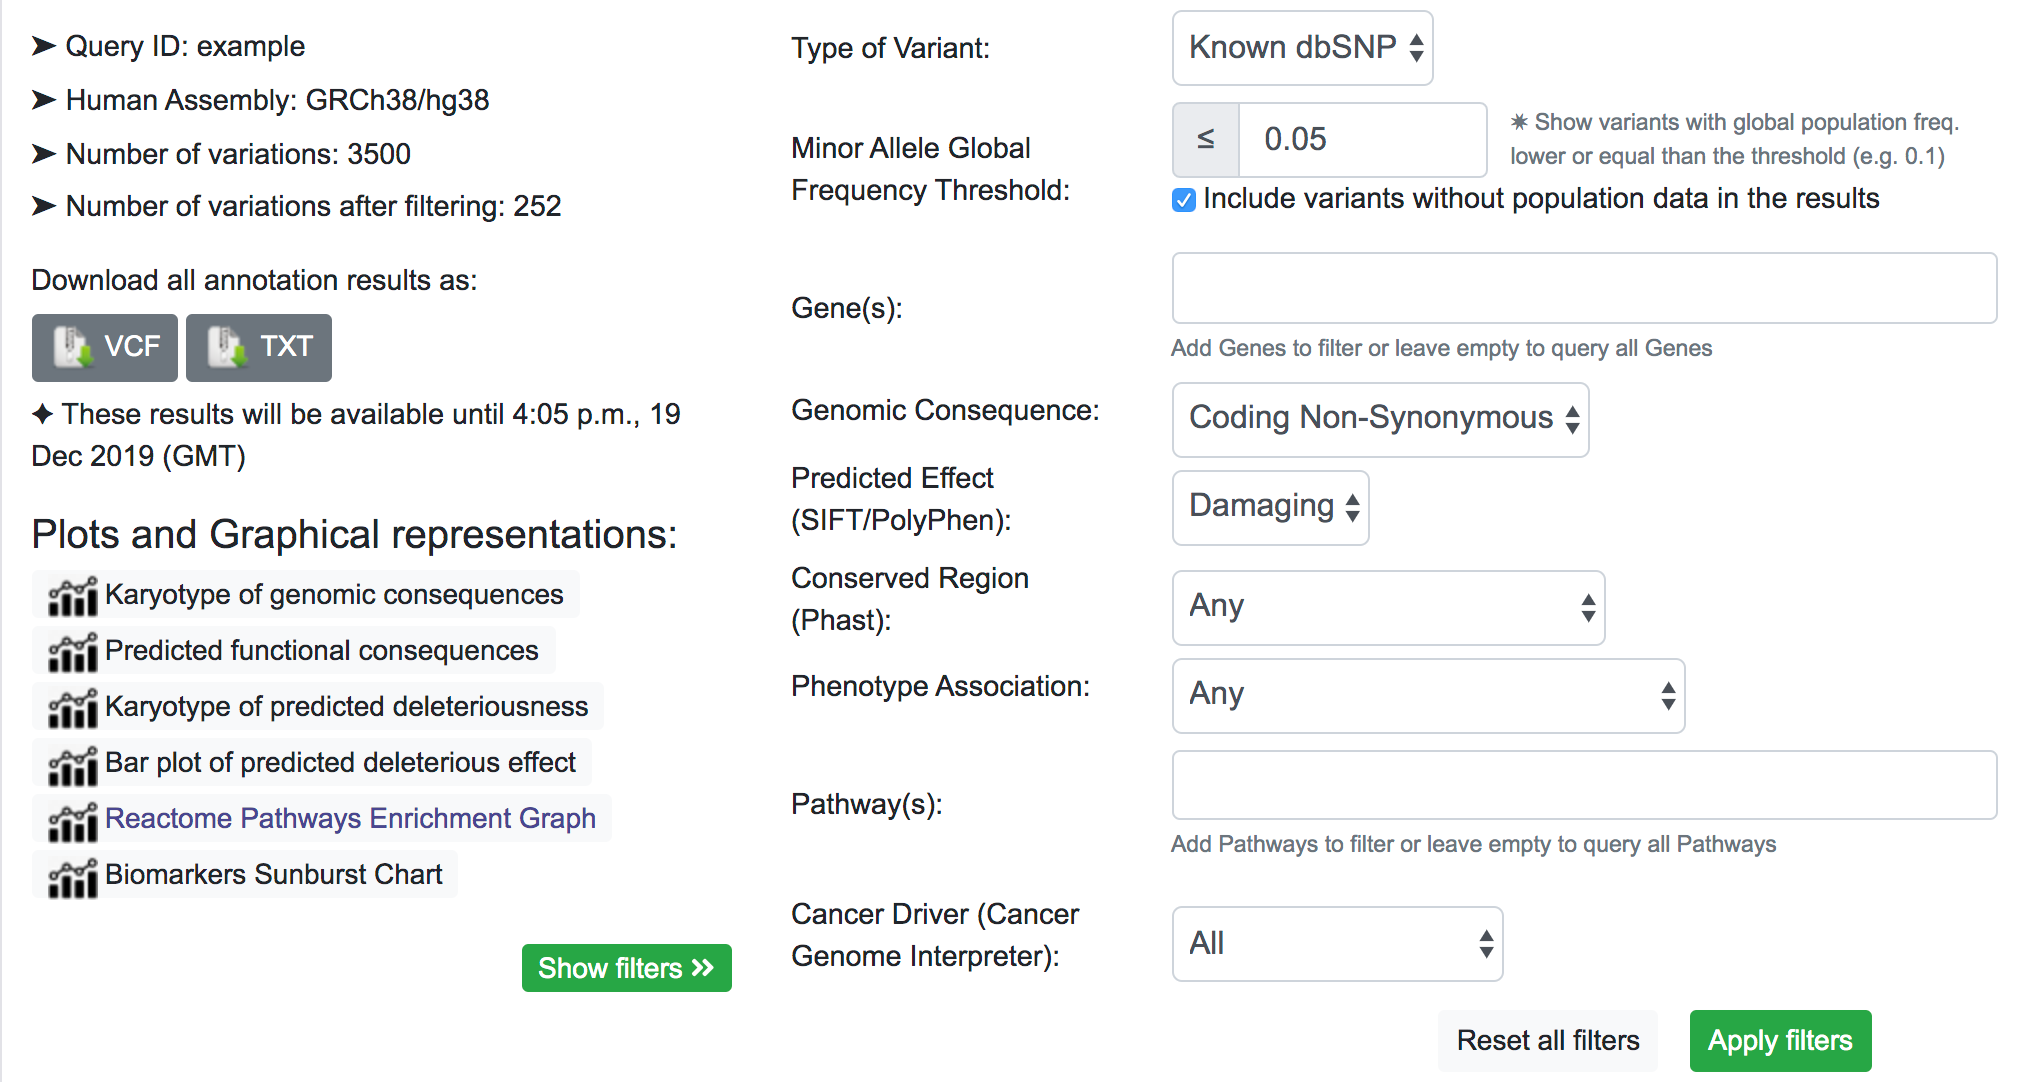
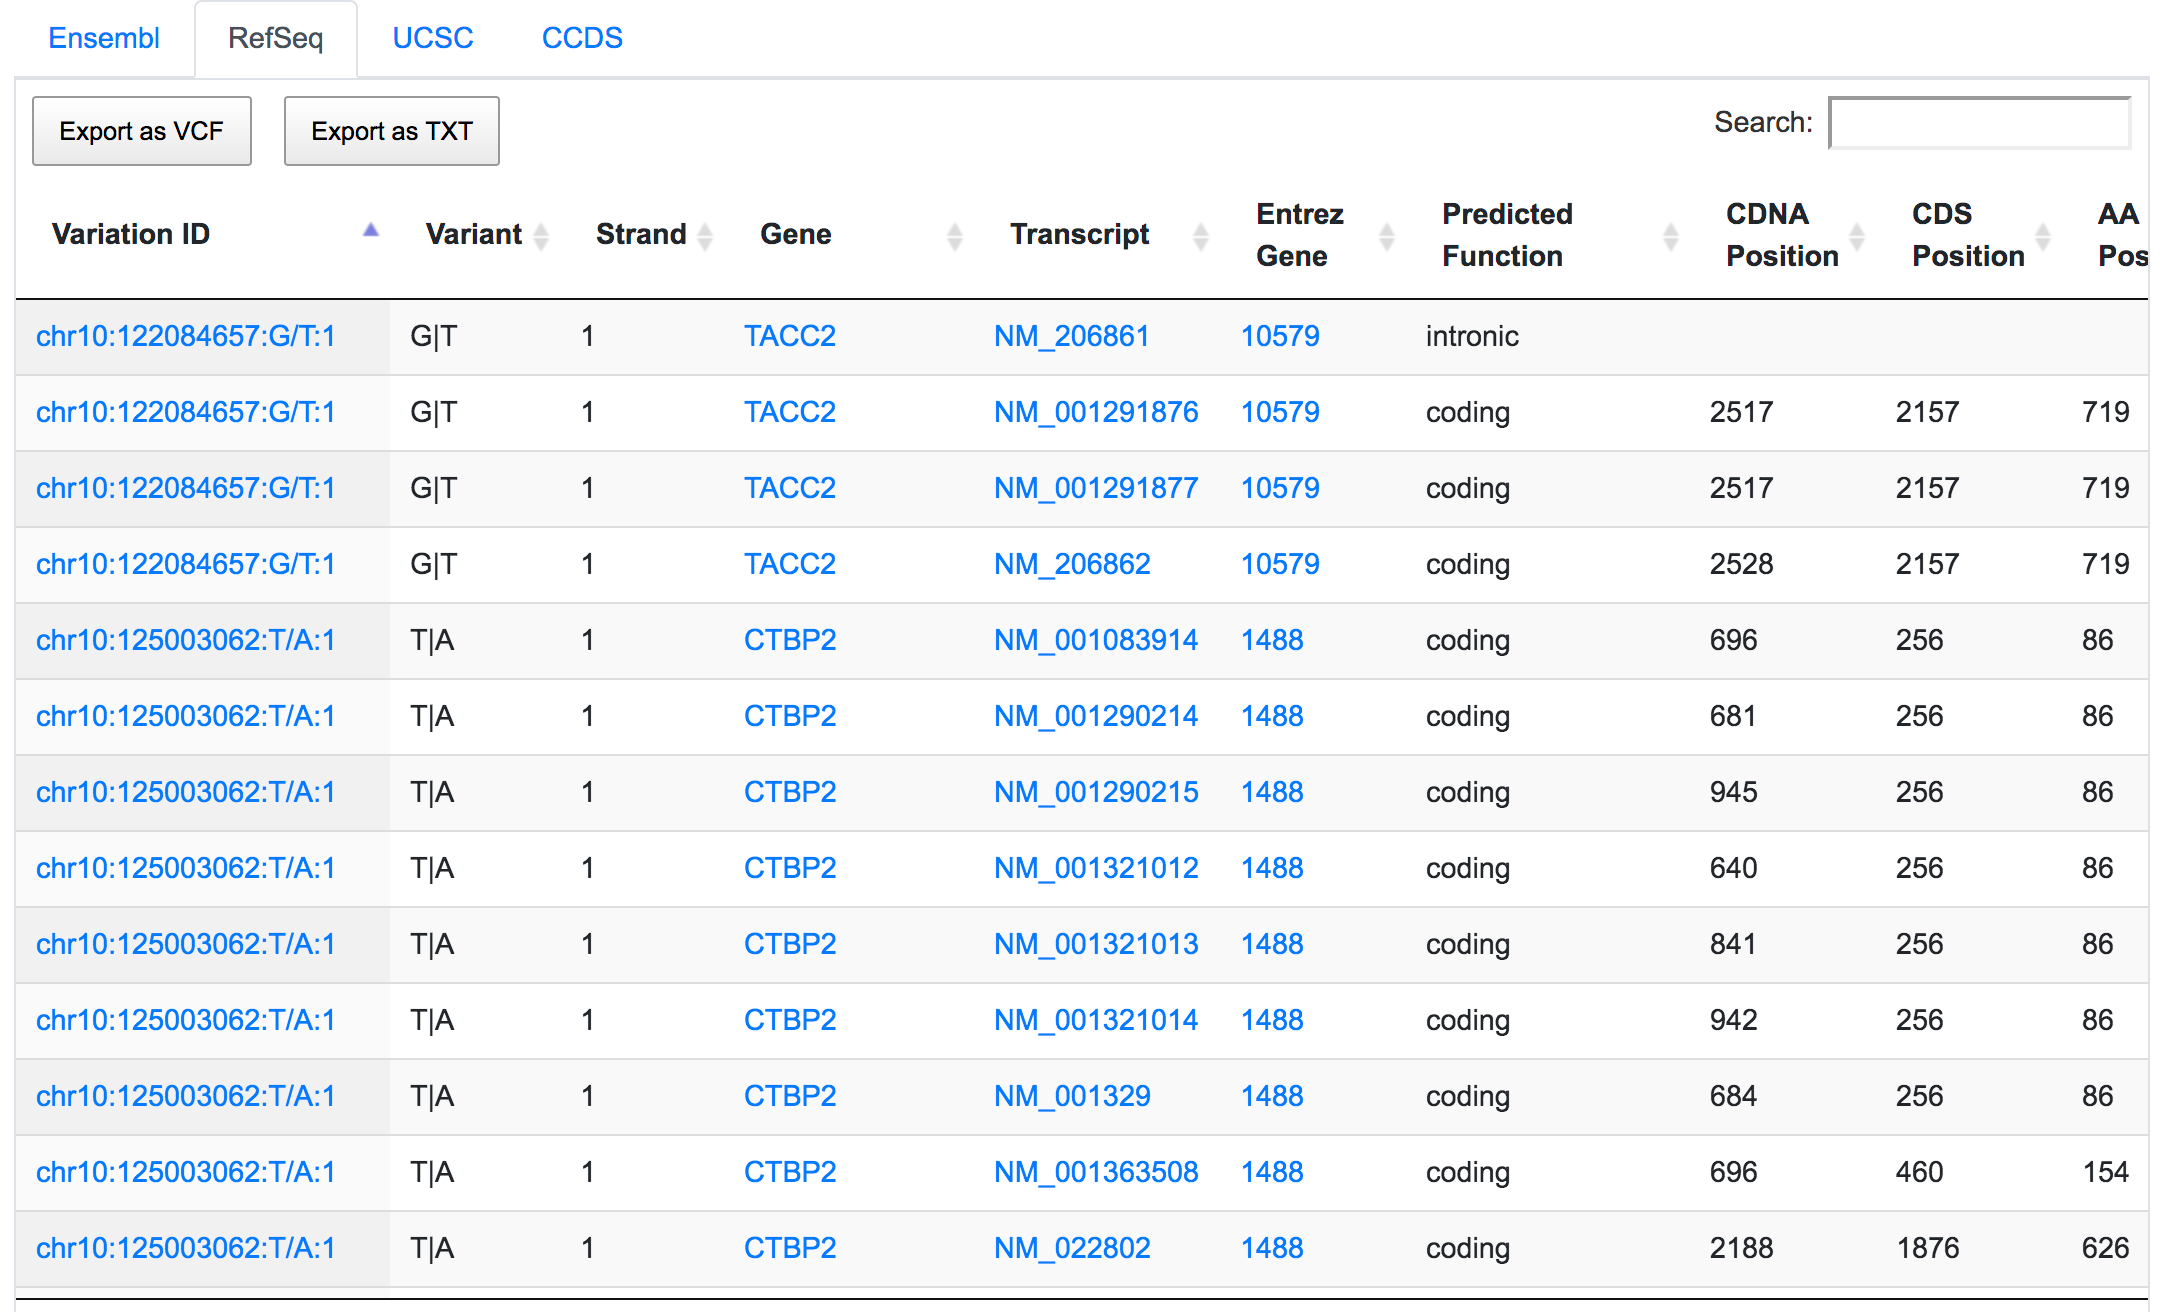
Only 252 variants remain after applying the respective filters. If we go through the genomic consequences results, we will see that, despite the coding non-synonymous filter, there are still variants that have predicted consequences like intronic or non-coding. This is because the result returned by SNPnexus is always variant-focused rather than consequence-focused. In this case, SNPnexus shows all the consequences for a variant as long as the variant has at least one coding non-synonymous consequence. In the example below, we can see that the variant chr10:122084657:G/T has coding non-synonymous consequences for three transcripts, but it also has an intronic consequence for one transcript (NM_206861).
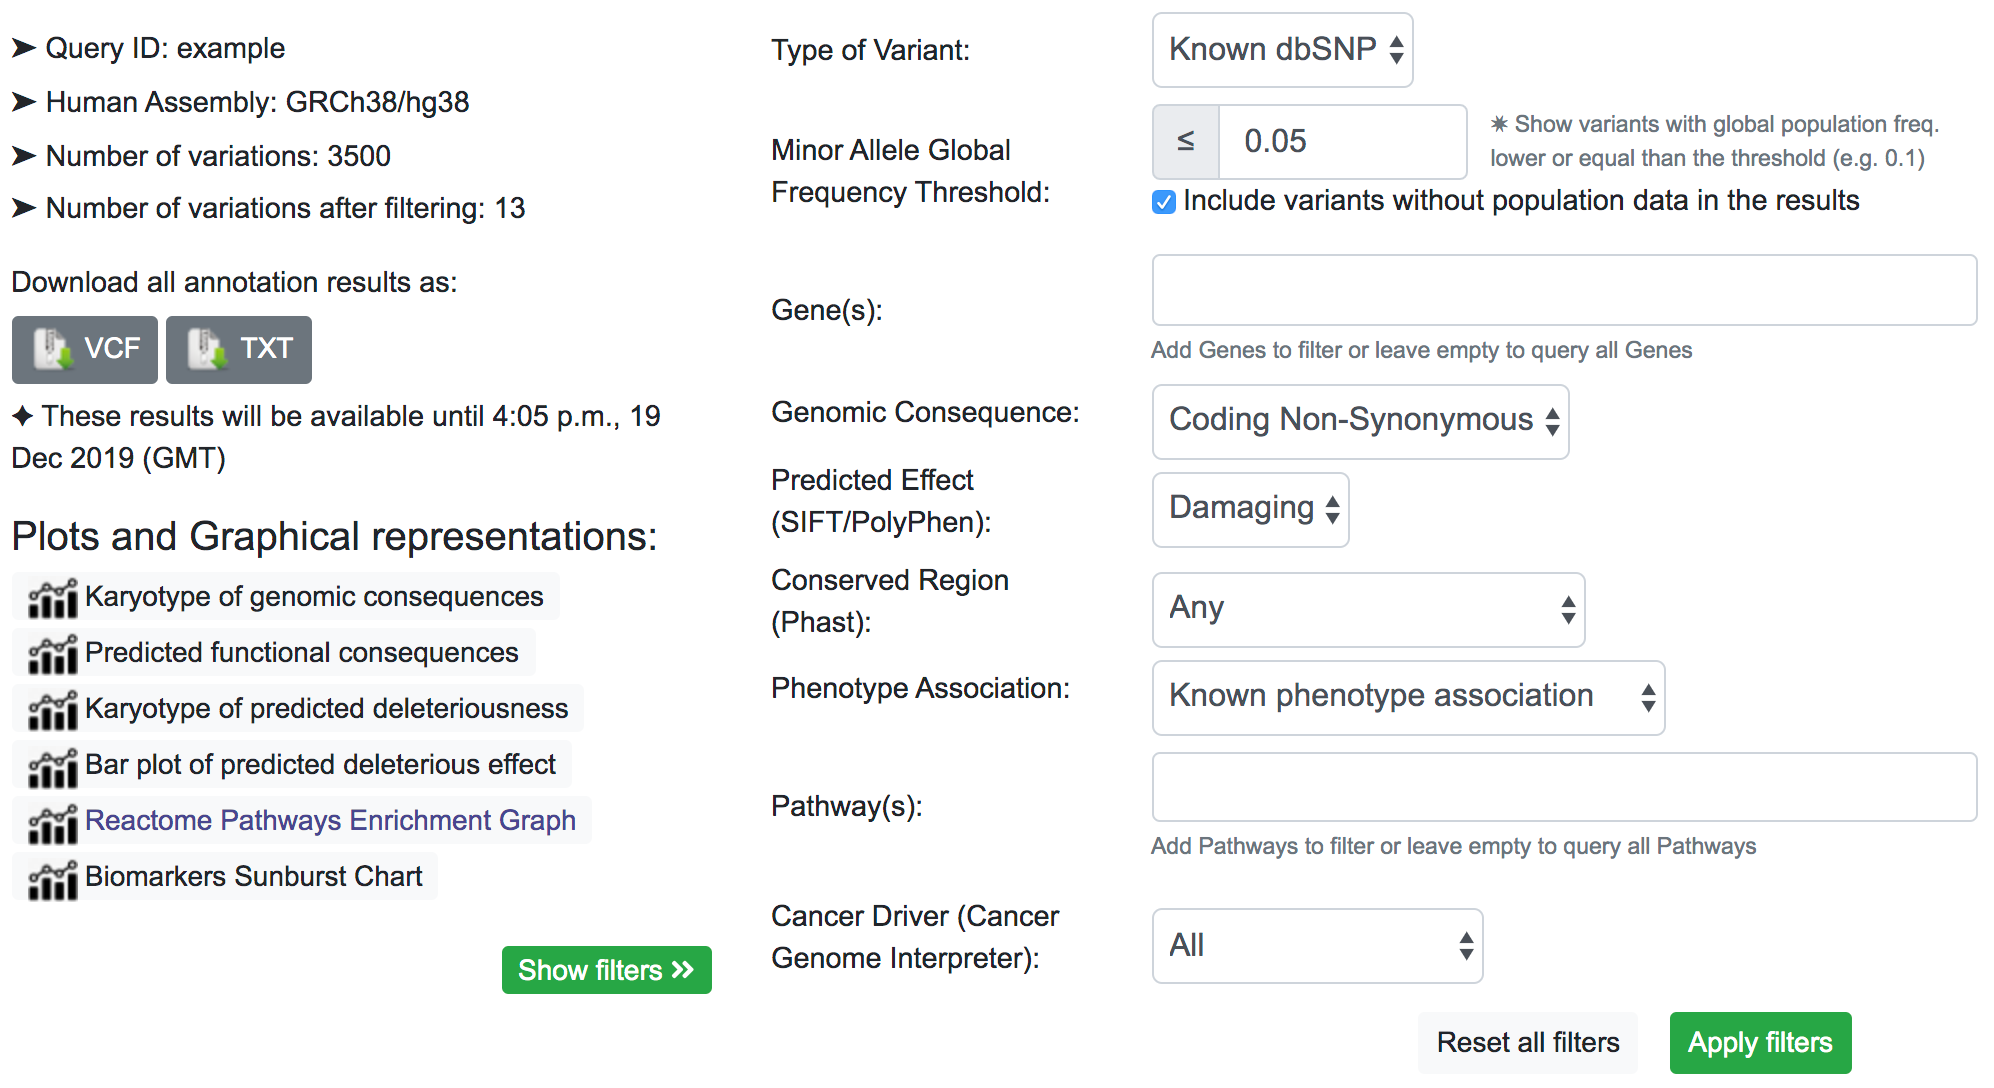
Now we may want to know which variants have a known phenotype association. After applying that filter, only 13 variants remains.
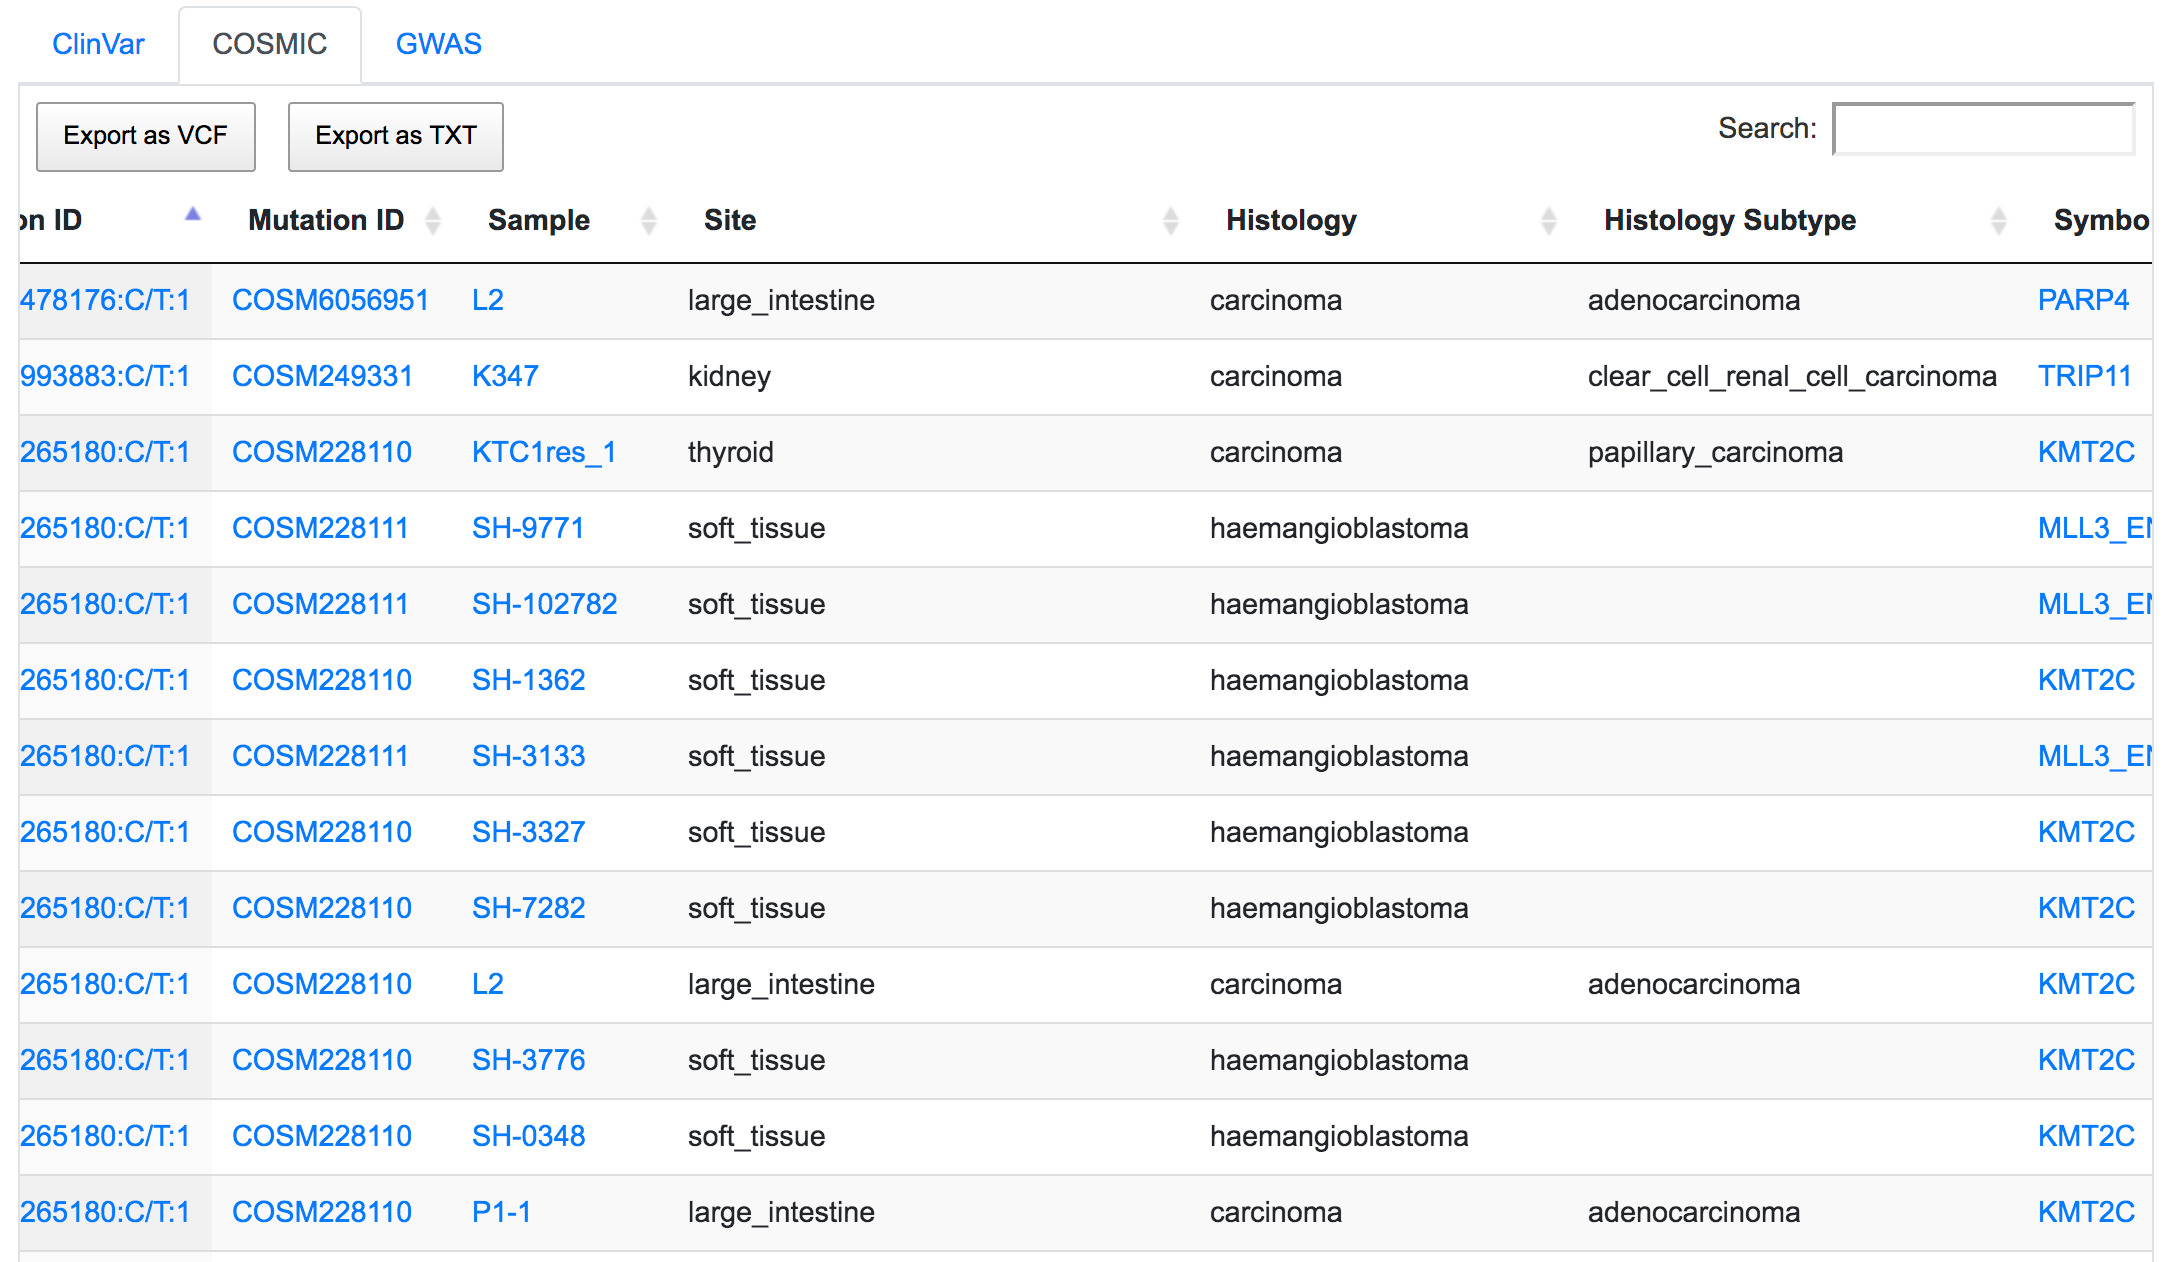
Finally, we can be interested in a few specific genes. As shown below, we include the Lysine Methyltransferase 2C (KMT2C), the Poly(ADP-Ribose) Polymerase Family Member 4 (PARP4), and the Thyroid Hormone Receptor Interactor 11 (TRIP11) in the Gene(s) filter.
After filtering, by inspecting the COSMIC results, we now have an idea of the associated disease related to these variants. Similarly to the previous filter example, the returned result is variant-focused rather than gene-focused. The variant of interest may overlap with genes other than the genes of interest. in which case we see some results in COSMIC table related to genes not included in the filter (namely MLL3). This is because the same variant that overlaps the KMT2C gene also overlaps MLL3.
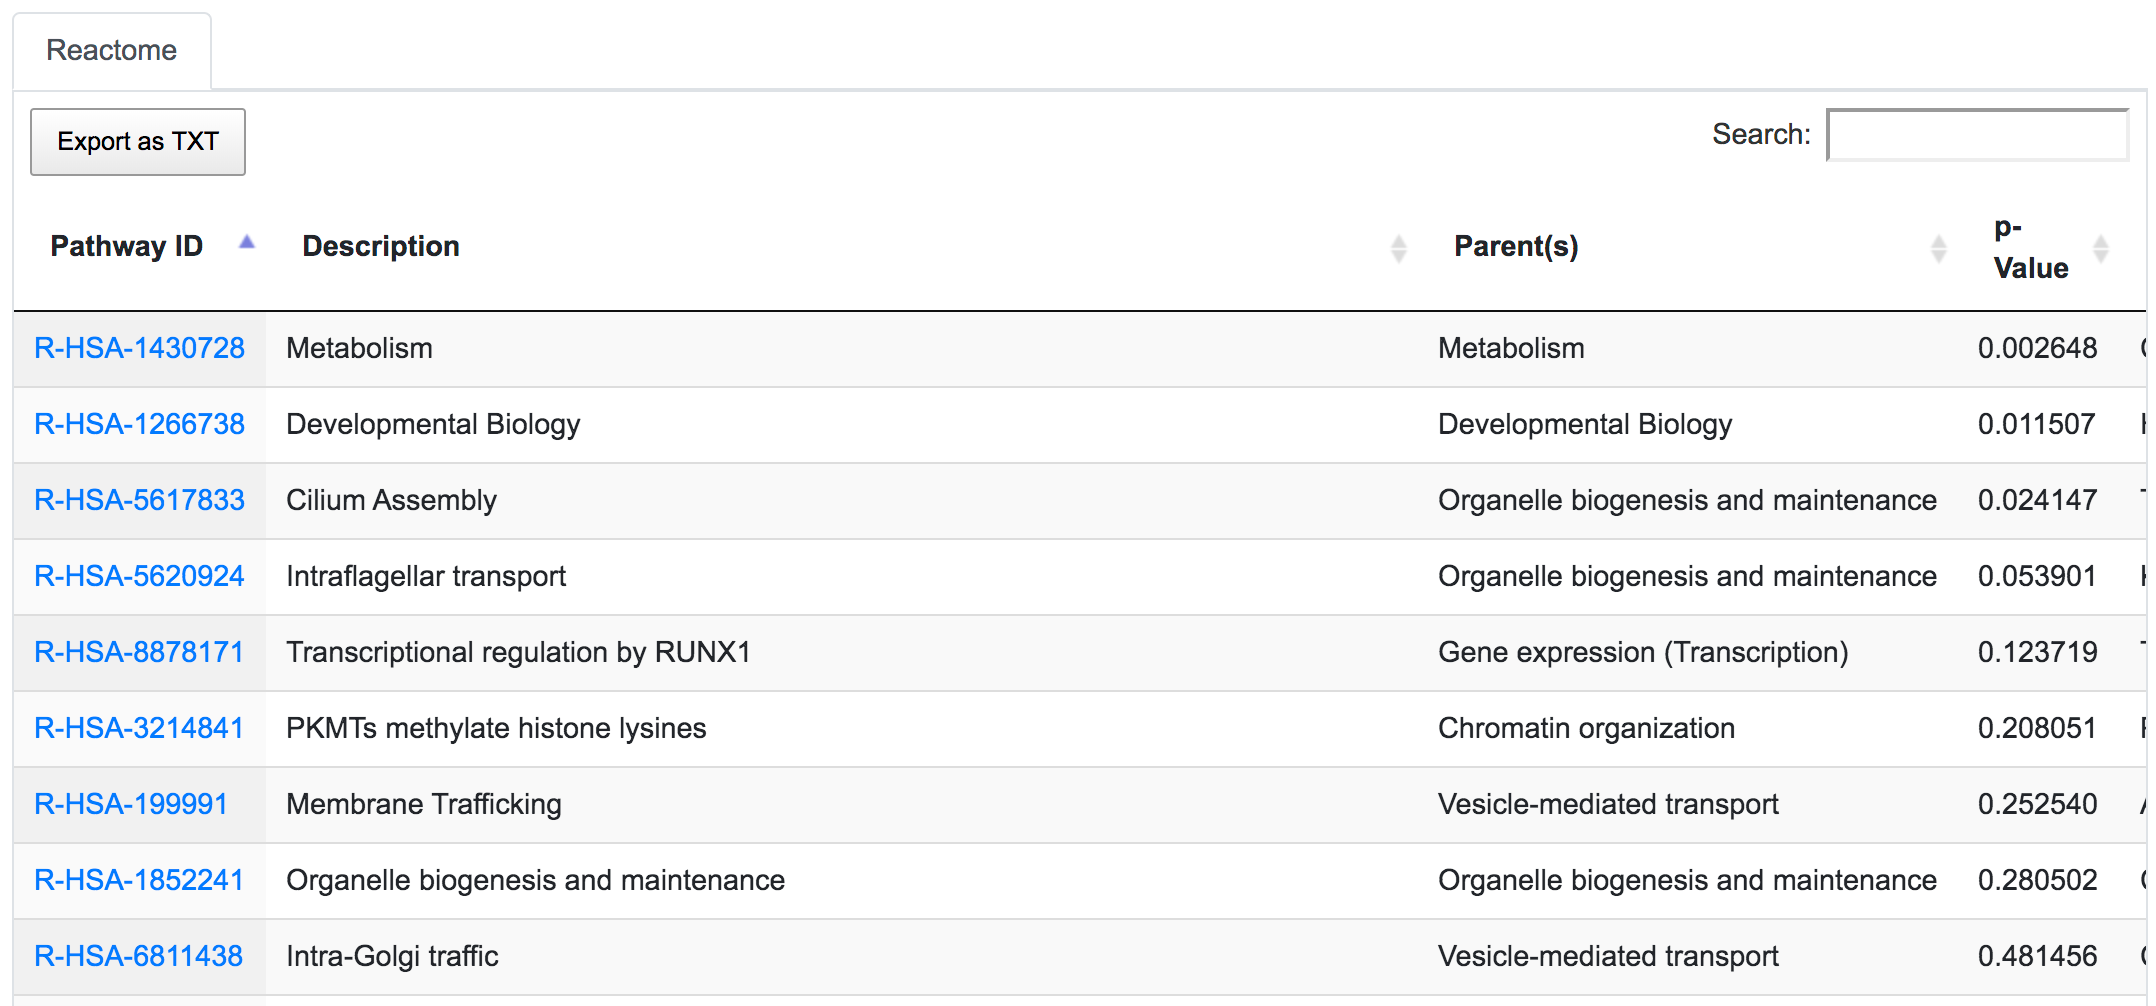
In the Reactome table, we can see the pathways related to these remaining variants of interest in the order of their significance value (p-Value). This significance is computed using the complete set of genes from the original unfiltered query.
It is worth noting that the filtering process is also reflected on the graphical representations. For example, the karyotype below shows the variants after filtering for known dbSNPs with MAF < 0.5 and coding non-synonymous consequence.